You are using an out of date browser. It may not display this or other websites correctly.
You should upgrade or use an alternative browser.
You should upgrade or use an alternative browser.
I have found the Holy Grail indicator for the Dow Jones - 100% right so far
batsonar
Experienced member
- Messages
- 1,438
- Likes
- 126
This is my EzAlgo indicator which is a paid indicator on Tradingview. As you can see there is a small "RED" cross above the last candle. This is what is known as a mild "SELL" single on EzAlgo. This means that the DOW could be about to make a move to the downside in the short-term. The indicator at the bottom is called VuManChu Cipher B. As you can see there is a small "RED" dot on the blue wave. This is also a "SELL" signal.

Last edited:
TEAMTRADER
Active member
- Messages
- 207
- Likes
- 86
TEAMTRADER
Active member
- Messages
- 207
- Likes
- 86
TEAMTRADER
Active member
- Messages
- 207
- Likes
- 86
I waited for my entry - and it was a struggle to stay in but eventually got 103 points.
Thanks Batsonar!
TEAMTRADER


Thanks Batsonar!
TEAMTRADER
TEAMTRADER
Active member
- Messages
- 207
- Likes
- 86
It is because the Dow is trending up - there was a huge huge support on 3 Oct.
It is trending up with the normal divergence so as I see it there is a waning momentum but still plenty of it so I will be scalping upwards till my scalping indicator show otherwise - and your super signal too.
Thanks
TEAMTRADER
PS
My 'next day' stocastic has crossed down but that - to me - only indicates profit taking with the amount of momentum on the chart.
Last edited:
batsonar
Experienced member
- Messages
- 1,438
- Likes
- 126
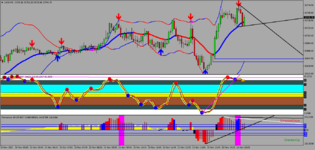
This is my "BATSONAR" indicator. As you can see the indicator has crossed the zero line back into the "RED". This is a "SELL" signal which means that the DOW could be about to make a move to the downside in the short-term. There is a "Pivot Point" resistance level at 34,195 (see green line) which the DOW has rejected from. More than likely more downside to come on the DOW.

batsonar
Experienced member
- Messages
- 1,438
- Likes
- 126
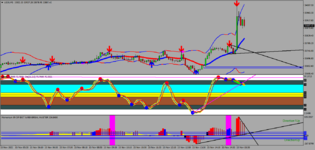
This is my EzAlgo indicator which is a paid indicator on Tradingview. As you can see the DOW has strongly rejected from the resistance level (see solid red line). The indicator at the bottom is called the VuManChu Cipher B. As you can see there is a "RED" dot on the blue wave which is a "SELL" signal. This means that the DOW could be about to make a move to the downside in the short-term.

batsonar
Experienced member
- Messages
- 1,438
- Likes
- 126
Although the DOW closed up today 734 points at 34,587 intraday the DOW fell as low as 33,583 down 270 points. This means that the "SELL" signal I gave on Monday the 28th November 2022 turned out to be correct. It does look like the DOW is going to make a move higher over the short-term.
batsonar
Experienced member
- Messages
- 1,438
- Likes
- 126
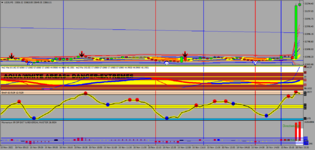
This is my ROC (Rate of Change) indicator. As you can see the indicator has crossed the zero line back into the "GREEN". This is a "BUY" signal which means that the DOW could be about to make a move to the upside in the short-term. As you can see on the chart below there is a "Pivot Point" support level (see blue line) at 33,630.

TEAMTRADER
Active member
- Messages
- 207
- Likes
- 86
Ouch! The only reason I did not enter was that the 4hr chart was already in a highly overbought area.
I could have scalped upwards and got a quick 40 points but it was so volatile I stayed out all day.
TEAMTRADER
I could have scalped upwards and got a quick 40 points but it was so volatile I stayed out all day.
TEAMTRADER
Similar threads
- Replies
- 50
- Views
- 19K
- Replies
- 0
- Views
- 2K