You are using an out of date browser. It may not display this or other websites correctly.
You should upgrade or use an alternative browser.
You should upgrade or use an alternative browser.
I have found the Holy Grail indicator for the Dow Jones - 100% right so far
Lord Flasheart
Legendary member
- Messages
- 9,826
- Likes
- 985
you said there could be a move either way but you went short on this?Just closed my "SELL" position for a profit of £4,344 in only 30 seconds. I traded the CPI data release.
View attachment 321661
batsonar
Experienced member
- Messages
- 1,438
- Likes
- 126
Yes because the DOW made a sharp move to the downside at 1:30 pm GMT so I went "SHORT" immediately. I was carefully watching it.you said there could be a move either way but you went short on this?
Lord Flasheart
Legendary member
- Messages
- 9,826
- Likes
- 985
Any chance you could call out a few of your trades in advance. I'm sure many of us are keen to learn from you. I don't want to think of you as the guy who goes on holiday comes back and say's "guess how many birds I shagged"Yes because the DOW made a sharp move to the downside at 1:30 pm GMT so I went "SHORT " immediately.
batsonar
Experienced member
- Messages
- 1,438
- Likes
- 126
It's a little difficult to call out the trades in advance because I can be in and out of trades within a few minutes. I don't really have time to post because I'm watching the trades carefully. I will be posting DOW signals at the end of the trading day so you will be able to follow them. I don't day trade that often.Any chance you could call out a few of your trades in advance. I'm sure many of us are keen to learn from you. I don't want to think of you as the guy who goes on holiday comes back and say's "guess how many birds I shagged"
TEAMTRADER
Active member
- Messages
- 207
- Likes
- 86
The down move was predictable although the severity was not. There was substantial bearish divergence.
If only................
TEAMTRADER
If only................
TEAMTRADER
batsonar
Experienced member
- Messages
- 1,438
- Likes
- 126
I just had a feeling that the DOW was going to reject and fall from the resistance level that I pointed out yesterday in my post. Yes the severity was a surprise.The down move was predictable although the severity was not. There was substantial bearish divergence.
If only................
TEAMTRADER
TEAMTRADER
Active member
- Messages
- 207
- Likes
- 86
I used to trade the news with Dustin Pass - very successful till the brokers caught on.I just had a feeling that the DOW was going to reject and fall from the resistance level that I pointed out yesterday in my post. Yes the severity was a surprise.
TEAMTRADER
batsonar
Experienced member
- Messages
- 1,438
- Likes
- 126
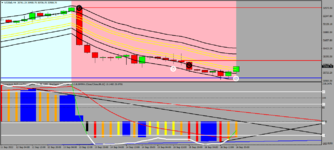
This Is my "BATSONAR" indicator. As you say see below the indicator has fallen from the 100% "GREEN" level and has now crossed the zero line back into the "RED" and is reading -12%. This is a "SELL" signal which means that the DOW could be about to fall further in the short-term. There is a "Pivot Point" support level (see pink line) at 30,586 so it is possible the DOW could fall to this level in the next day or so. I am a little reluctant to call a "SELL" signal because it is possible the DOW could recover in the next day or so from such a massive fall today of 1,276 points. Remember this strategy has a win rate of 82%.

Last edited:
batsonar
Experienced member
- Messages
- 1,438
- Likes
- 126
See DJI (Dow Jones (US 30) in the list below. As you can see the Stochastics are reading between 6 - 19. Any reading below 20 is considered oversold. This means that the DOW could be about to bounce from recent lows and make a move to the upside next week.

Last edited:
TEAMTRADER
Active member
- Messages
- 207
- Likes
- 86
Yes, I agree that there will be a fight back but there will be volatility.
My stochs has crossed on the 4hr chart and there is significant divergence on both the 4hr and daily charts which suggests a reversal point.
If I were going to trade on Monday - which I am not - it would be up moves.
TEAMTRADER
My stochs has crossed on the 4hr chart and there is significant divergence on both the 4hr and daily charts which suggests a reversal point.
If I were going to trade on Monday - which I am not - it would be up moves.
TEAMTRADER
Attachments
batsonar
Experienced member
- Messages
- 1,438
- Likes
- 126
This is a 1 hour chart of the Dow Jones (US 30). This is my EzAlgo indicator which is a paid indicator on Tradingview. As you can see the Dow has come down to a support level (solid blue line) at 30,570 and a blue "BUY" label has been printed. Its more than likely that the Dow is heading up towards the resistance level (solid red line) at 31,004. Also on the chart is the Price Projection Forecast indicator (see purple and yellow dotted line). This suggests the Dow will hit the resistance level at 31,004.

Last edited:
Similar threads
- Replies
- 50
- Views
- 19K
- Replies
- 0
- Views
- 2K