I have found the Holy Grail indicator for the Dow Jones - 100% right so far

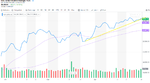
Here's a curve fitting exercise worth trying. Set your DOW chart to monthly and draw two Exponential Moving Averages (EMAs) on it. Set one to '12' and the other to '14'. Now add the MACD indicator below it. We can use the MACD to highlight and amplify the difference between the two EMAs by setting the fast line to 12 and the slow line to 14 (ignore the signal line and the histogram, in fact make them disappear if you can). I've done this on the chart below and for the last 30 years it's given a good indication of the various swings of Bull and Bear markets (mostly Bull!) Basically, Bull markets are indicated when the fast EMA (the red one on my chart) is above the slow EMA (the black one). Vice versa for Bear markets. This is reflected by the MACD too, as you'd expect - Bull markets are Green and Bear markets Red. What I'm trying to show, is that the next stock market crash won't develop on a daily chart whose indicators are probably calculated from the last 20 - 30 closes. You need to take a step back and look at the bigger picture - if curve fitting has any value at all!
DJIA.png
 
End of the world confirmed 100%, fully back tested, its even being televised.
And its starting in May !


Batsonar really knew what he was talking about.
 
As a rule, Buy/Signals are generated on crossovers of the McClellan Oscillator and the center (zero) line: when the oscillator advances into positive territory (above zero) a "Buy" signal is generated and when the oscillator falls into negative territory (drops below zero), a "Sell" signal is generated. At the same time, traders may look at positive and negative divergences between the McClellan Oscillator and the price trend.
James.jpg
 
Should I sell my short that I bought on the buy of a sell signal? The market has been pushing forward and I'm not sure if my stop will hold or will it stop at the point where the market decides to turn? I think I see a pivot point approaching, but all this talk of McEllen oscillating means that if it crosses over the pivot point it could mean a downturn is on the way.

I've been looking at elliot and he says that we are in possible wave b of [C] of 3 and I'm sure that means we are about to crash, elliot has been forecasting a crash for about 10 years now and I think it will happen on the 1st of May, which means my stop will be safe at 26.611.11?

I have no reason to believe the Dow is going to make a move up. All my indicators are in the negative so more likely the Dow is going to make a move down. The buying volume is decreasing so I can't see how the Dow is going to move up. I might be wrong. I have a gut feeling the Dow is going to crash in May. Just hold in there and be patient.
 
The Dow is behaving like an ass hole. It has been hugging the flat line for the past 8 days. It doesn't know whether to make a move up or down. The main indicator I use is the one at the top underneath the date. It gave a "sell" go short signal (the indicator fell from the green 100% level) the other day so I went short. Yesterday it hit the red 100% level but today it has turned up so this is a "buy" go long signal. The second indicator has passed the "zero" line into the green. The bottom indicator has also passed the "zero" line into the green. I am ignoring these "buy" go long signals because I am a "bear" trader. I feel the Dow will not reach new highs. I think there could be a big move down in May and even a possible crash. I will wait for another "sell" go short signal. I am not going long on the Dow. On my real money account with Trading212 I have just over a £1,000. I closed my short position I made the other day with a loss of £21.50. I am only trading 0.3 contracts.
Hacche.jpg
 
The Dow is behaving like an ass hole. It has been hugging the flat line for the past 8 days. It doesn't know whether to make a move up or down. The main indicator I use is the one at the top underneath the date. It gave a "sell" go short signal (the indicator fell from the green 100% level) the other day so I went short. Yesterday it hit the red 100% level but today it has turned up so this is a "buy" go long signal. The second indicator has passed the "zero" line into the green. The bottom indicator has also passed the "zero" line into the green. I am ignoring these "buy" go long signals because I am a "bear" trader. I feel the Dow will not reach new highs. I think there could be a big move down in May and even a possible crash. I will wait for another "sell" go short signal. I am not going long on the Dow. On my real money account with Trading212 I have just over a £1,000. I closed my short position I made the other day with a loss of £21.50. I am only trading 0.3 contracts.

Arrghhh! I thought this was 100% guaranteed never failed.
 
Can I ask you DID you actually watch my video or are you like the majority of people that come to the conclusion that there is not such thing as a Holy Grail trading system without even looking at the evidence on my video? Only stupid people do that. Watch my video and prove my system doesn't work. I challenge you.
I did watch your video from start to finish and my summary was based entirely on what YOU said in it.
I came to the conclusion there is no such thing as a Holy Grail trading system long before this incarnation appeared. ALL the others failed, this one will too. I don't need to prove your system doesn't work, it will do that all by itself.

...
 
Just look at this chart!
There is NOTHING on here that says the dow will fall any time soon! Everything is going up, why fight it on the off chance you might be right once in 100 times.
 

Attachments

  • DJ100.png
    DJ100.png
    91.2 KB · Views: 133
Arrghhh! I thought this was 100% guaranteed never failed.

When the market is this flat for days and I have noticed on backtesting in flat periods in the market the indicator I am using can fluctuate over a few days. What my system is good at is catching the big moves early. It needs to tested over a year. If I make much more money that I lose then it's a good system.
 
Last edited:
The Dow went as high as 26,713 today but has fallen back to 26,432 at time if writing. I personally do not think the Dow will ever reach new highs. Its struggling. The buying volume is decreasing and the selling volume is increasing. I am expecting break down soon and a major fall even a possible crash.
 
So lets just recap the last nine days.

I really do have the PERFECT trading system that predicts the moves on the Dow Jones which appears to be 100% so far as being accurate.
I'm boasting of a system I have discovered which is 100% accurate.

I know what you mean. when I say 100% I mean more about predicting the big moves in the Dow Jones. You can't be accurate in a flat market because there isn't enough movement up or down but my indicators cope well but I know if you use my signals you are going to make far more money than you are going to lose if you make sure you use tight stops.
Yeah its 100% BUT ... with conditions and stops.

.... I think the Dow could be going down. I might be wrong. We shall see.
Err its not working, lets try willing the dow to fall.

.. I am 90% sure it is going to fall over the next week. I haven't bothered putting in a "stop" because I regularly check my charts so that if my signal fails I will close my position....
Down to 90% certainty, dont bother with stops any more, entertaining the possibility a 100% system may fail.

.... Apparently about 80% of traders lose money so do the opposite to what everyone else is doing. I use Traing212 and on there it tells you the percentage of buyers and sellers. When the level gets to around about 78% buyers I then think about going short. When the level gets to about 78% sellers then I then think about going long.
Ignore the 100% correct indicators I just discovered, we're contrarian trading now.

I have no reason to believe the Dow is going to make a move up. All my indicators are in the negative so more likely the Dow is going to make a move down. The buying volume is decreasing so I can't see how the Dow is going to move up. I might be wrong. I have a gut feeling the Dow is going to crash in May. Just hold in there and be patient.
Blind faith - "I cant see it so it cant happen".
I'm going by gut feel now.


The Dow is behaving like an ass hole. It has been hugging the flat line for the past 8 days. It doesn't know whether to make a move up or down... I am ignoring these "buy" go long signals because I am a "bear" trader. I feel the Dow will not reach new highs. I think there could be a big move down in May and even a possible crash. I will wait for another "sell" go short signal. I am not going long on the Dow. On my real money account with Trading212 I have just over a £1,000. I closed my short position I made the other day with a loss of £21.50. I am only trading 0.3 contracts.
I dont understand whats happening.
Ignore the signals that I told you were 100% accurate last week and just go short cause you identify with a particular trader type.
Lose money on a 100% guaranteed system.


All that in 9 days, any lessons learned - nah!
I 100% guarantee batsonar hasn't learnt anything from this!
 
So lets just recap the last nine days.


I'm boasting of a system I have discovered which is 100% accurate.


Yeah its 100% BUT ... with conditions and stops.


Err its not working, lets try willing the dow to fall.


Down to 90% certainty, dont bother with stops any more, entertaining the possibility a 100% system may fail.


Ignore the 100% correct indicators I just discovered, we're contrarian trading now.


Blind faith - "I cant see it so it cant happen".
I'm going by gut feel now.


I dont understand whats happening.
Ignore the signals that I told you were 100% accurate last week and just go short cause you identify with a particular trader type.
Lose money on a 100% guaranteed system.


All that in 9 days, any lessons learned - nah!
I 100% guarantee batsonar hasn't learnt anything from this!


Oh Ye of little faith.

Such bile, such cynicism! What happened to you Postie? Where's the happy-go-lucky chancer of yesteryear?:p

I can see that this system is indeed 100% guaranteed and I, for one, wish Batsonar a long and happy relationship with it.
 
Just for fun, here's what I think will happen.

Dow will now rise slowly for the rest of the day and gap open higher tomorrow. Currently 26280.

Just a guess.
 
Oh Ye of little faith.

Such bile, such cynicism! What happened to you Postie? Where's the happy-go-lucky chancer of yesteryear?:p

I can see that this system is indeed 100% guaranteed and I, for one, wish Batsonar a long and happy relationship with it.

Oh happy days.
If batsonar makes money in any way shape or form then more power to him, anyone who takes money out of the market is a winner.
But a 100% guaranteed system, ...

 
Oh happy days.
If batsonar makes money in any way shape or form then more power to him, anyone who takes money out of the market is a winner.
But a 100% guaranteed system, ...

Your two statements are not mutually exclusive.....

I insist, it's a 100% guaranteed system :)
 
Just for fun, here's what I think will happen.

Dow will now rise slowly for the rest of the day and gap open higher tomorrow. Currently 26280.

Just a guess.

Thats 100 points offside already - so much for having fun.
 
Top