Mr. Charts
Legendary member
- Messages
- 7,370
- Likes
- 1,200
exited half 18.07 to lock in
Hi Richard
I've followed this thread with interest - thanks for all your time and input
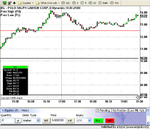
You say this method can be utilized without L2 but I'm finding it hard to see how you select your entries without reference to your L2 data (which I don't have). Looking at your STI chart you entered just before the previous day's low was coming up and, as Nearlythere observed, just prior to a round number. Not the most inviting setup, especially given the two prior fake-outs. So, is this a realistic trade without L2, or is it simply a quickening cascade of lower bars (or higher for longs) that is the main decision criteria?
The ATR on the chart is also very low at your entry - is that then a major factor in your decision to enter, or just a supporting factor?
Thanks
WR
Hi Richard/others,
Could you please shed some light on how they have this set up to identify trades on time?
Consider this - on any given day, one identifies about 10-20 stocks (via scanner) that are trade-able. To enhance probability of success, one needs to monitor trends on 1 min, 3 min and 5 min candles. For 10 stocks, that is 30 charts. Since there is not an algorithmic trigger logic, how do you detect a possible trade? (Perhaps, there is a trigger - I just do not get it yet. Or you actually have 30 charts up!)
Am I approaching this entirely the wrong way?
I ask because I set out to work on this method and have not had success locating trades in time. Ideally, I would assume scans are done intra-day as well.
Thanks for any advice in advance. As well as, thanks for sharing so much information on these forums. It has been very helpful for a novice like me.