Best Thread How To Make Money Trading The Markets.

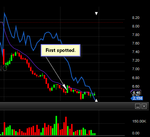
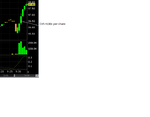
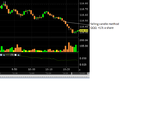
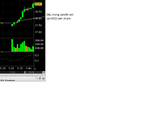
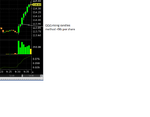
Here is one I spotted in FMSA right near the move in ZIOP. I had just opened the chart and didn't have time to set up for a trade but noticed pretty tight consolidation in the previous candlestick which was at the bottom of a clean trend down. About $0.08-$0.10 was available here. A good example of how you need not find just the monster trends that Mr. Charts usually does to make money :) $120.00 here, $150.00 there adds up rather nicely in short order. A somewhat sloppy application of the second method discussed in this thread. Obviously, there were many earlier and more profitable trading opportunities in this chart.
 

Attachments

  • 2016-07-15_115307crcr.png
    2016-07-15_115307crcr.png
    15.7 KB · Views: 154
Here are two more opportunities. The first image is a 3 minute chart. AMD took off right out of the gate. My goal was to get in on a break above the nearby high above the white line but it was moving quickly. I sent the order to buy at $6.00 which was executed at about $6.02. I was also late taking action on this as I get squeamish about entering trades so close to the open but I still ended up making about $0.06 out this trade. When it hit $6.10 it seemed to stall a bit and the fluctuation made me exit too early. But I protected myself and was happy to walk away with profit.

In the past I hadn't really thought too much of using 1 minute charts to find meaningfully profitable trades using the methods Mr. Charts uses in this thread. I had always seen 1 minute charts as a way to gauge and manage a trade that was already in play. This impression changed permanently when after finishing the above trade I looked at what was going on in the same trend on the 1 minute chart as seen below in the second image. New opportunities became clear. Candlesticks that were sloppy, unreadable and untradeable in the 3 minute chart were revealed to be hiding something else entirely. The same methods, the same approach, just a different time frame.
 

Attachments

  • 2016-07-25_094308 3min.png
    2016-07-25_094308 3min.png
    12.4 KB · Views: 131
  • 2016-07-25_094308 1min.png
    2016-07-25_094308 1min.png
    14.2 KB · Views: 131
I trade on 1 min, 3 min and sometimes 5 min candles.
With FX it tends to be on longer time frames even including days sometimes.
 
Seven trades today, five winners, two losers.
Only one trade used the method in this thread (the rest used some of the other set ups I trade) and produced a profit of 50c per share.
Pointer at time of entry, image taken at exit.
Winners and losers on my blog as always.
 

Attachments

  • 280716NAT.png
    280716NAT.png
    15.3 KB · Views: 230
I always have a look through the pre-market news stories as well as gappers and came across TOPS so it went on my alert list. I normally focus in on just a few stocks from market open and this was the first one I watched. Within seconds it was off north so I jumped on it. Obviously there were no rising candles prior to entry so it was more looking at the more detailed level L1 (or L2) T&S mentioned in my opening post on this thread.
That produced a good chunk of the ultimate move. White pointer at entry, image at time of exit.

+134c per share profit.

That's $1340 for a 1000 share position and obviously pro rata for anyone taking bigger or smaller position sizes.

Certainly a nice start to the dog days of August.

All trades winners and losers on my blog as always.
 

Attachments

  • 010816TOPS.png
    010816TOPS.png
    17.8 KB · Views: 249
Another one just like yesterday.
CVS +130c per share
 

Attachments

  • 020816CVS.png
    020816CVS.png
    13.3 KB · Views: 280
And yet again just like yesterday and the day before and so many other days
+79c a share AIG
 

Attachments

  • 030816AIG.png
    030816AIG.png
    11.1 KB · Views: 204
And yet again and again and again
EXEL +36c per share.

All alerted on my pre-market watch list
 

Attachments

  • 040816.png
    040816.png
    11.1 KB · Views: 182
And yet again.
Method, method, method.
MRK+50c per share profit
 

Attachments

  • 050816MRK.png
    050816MRK.png
    14.2 KB · Views: 198
Mr. Charts you really are amazingly good at catching these before the moves. Here's my attempt on a paper trade. I was just bouncing around looking at volume movers when I stumbled upon QVCA just a few minute ago. After the entry candlestick (the crosshairs) the small drop did give me some worry but since it didn't even drop past %50 of the previous candlestick and the volume was so low I didn't think it was very significant. $0.40 per share all the way up to the exit at $22.00. I tend to get a little antsy after a big move up and expect a retraction so I got out after it started to drop back down toward $22.00. From the following candlesticks you can see it was good thing I did. Even without any filters/alerts or news access it's possible to catch these. Although I wish I had Mr. Charts special sauce when it comes to that. :sneaky:
 

Attachments

  • 2016-08-05_122714.png
    2016-08-05_122714.png
    17.5 KB · Views: 226
Seven trades on a choppy dog day of August but still opportunities.
Six wins. one loss.
Two of my trades used the method in this thread.
SM +89c per share
QQQ +17c per share
 

Attachments

  • 080816QQQ.png
    080816QQQ.png
    17 KB · Views: 295
  • 080816SM.png
    080816SM.png
    20.7 KB · Views: 299
I just love BABA. When it moves from the get-go, it moves :)
+60c per share
 

Attachments

  • 100816BABA.png
    100816BABA.png
    15.3 KB · Views: 295
Back trading today after a month's holiday and straight into action.
A very nice one from my pre-market alerts using the set up in this thread.
When set ups occur they keep on working a high percentage of the time even on a flat day.
DAL +132c per share
Winners and losers on my blog as always. My other trades used different set ups, though this one was a beaut.
 

Attachments

  • 070916DAL.png
    070916DAL.png
    16.2 KB · Views: 330
Methods work on many trading instruments.
Here is one from today using the method in this thread, an ETF which is a stock equivalent to an index, the nasdaq 100.
QQQ +50c per share
 

Attachments

  • 120916QQQ.png
    120916QQQ.png
    15.3 KB · Views: 288
If you are asking whether that stock is going to go up or down, I would simply not trade it at its present position as it does not fulfill the criteria for the set up on this thread or any of the other set ups I use on a day to day basis.
 
Top