Lúidín
Established member
- Messages
- 818
- Likes
- 61
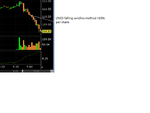
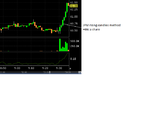
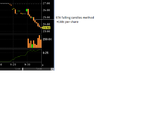
Overall exit rules are on the first few pages of the thread. It was a momentum play, so the exit was at the point of momentum dying off. The next bar would have been an exit anyway as per the mechanical rules.
Just out of interest - how would you have managed your exit if you were short? What information had you seen to tell you there was more downside to come ?
I take it Mr Charts can reply for himself..but as you asked..i will answer you
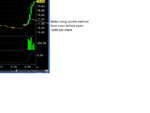
the stock made a long series of NRB's the previous day..then it gapped down..took out the PDL..this means the odds of it moving lower were high..which it did
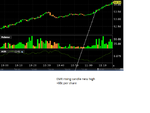
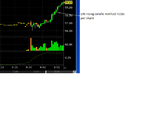
when a stock gathers momentum..you must maximise the moment..as this is what correct position sizing is all about
you can not apply the same rules at all times..as a stock does not move the same all of the time..horses for courses!
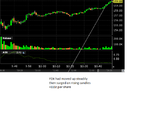
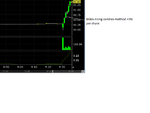
there is a term called "waterfall"..it is well worth learning about..if you can find the correct way that explains it..that is
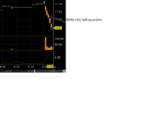
this is a cheap stock..which is not good to trade..as there are far better opportunities to be had trading +$50 stocks..but to do that effectively..you of course need adequate money..which most retail traders do not have..money makes money..that will never change