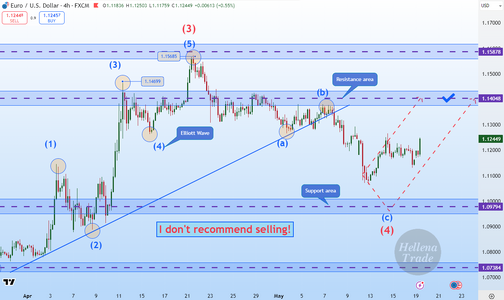
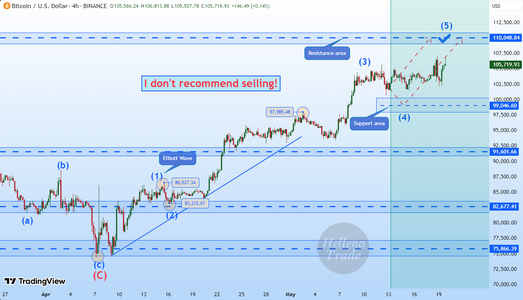
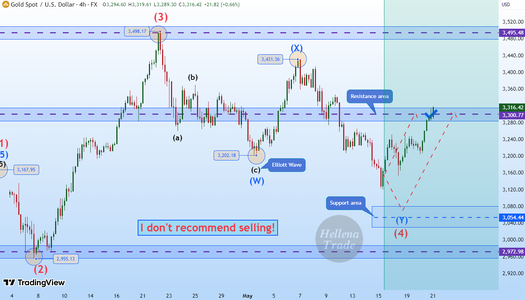
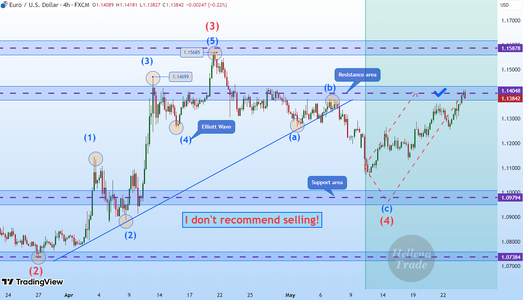
#EURUSD
🔔(UPDATE)🇪🇺EUR/USD (4H): LONG to the resistance area 1.14048.
➖➖➖➖➖➖➖➖➖
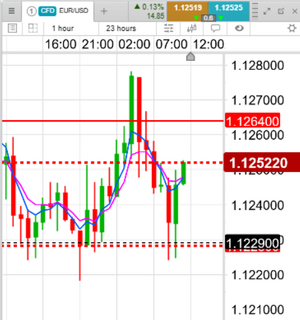
➡️Price is showing a nice bullish impulse towards 1.12659 level, which is quite positive within the forecast.
I expect the target of 1.14048 to be reached this week.
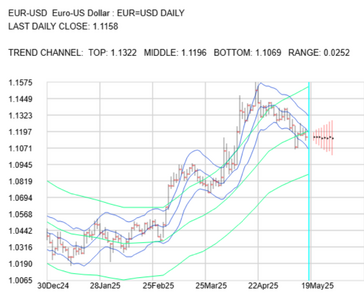
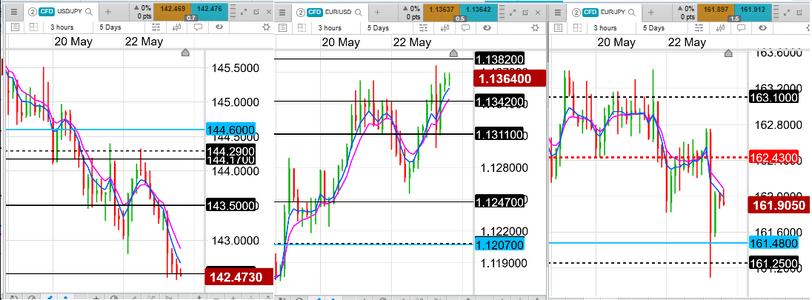
Hi Hellena, thank you for your Elliott Wave analysis for the EURUSD. Thought I would give you some feedback on what the maths I use is saying about this FX pair. I call the maths the Volatility Response Model for FX or VRMFX for short.
The VRMFX gives a Short Term Trend Channel or STTC shown in blue top, middle and bottom of the charts attached. STTC is calculated 1 day into the future.
The VRMFX gives a Long Term Trend Channel or LTTC shown in green top, middle and bottom of the charts attached. LTTC is calculated 1 week into the future.
I see that you calculate your Elliott Wave analysis just on EURUSD. For the VRMFX I always use a triplet analysis because
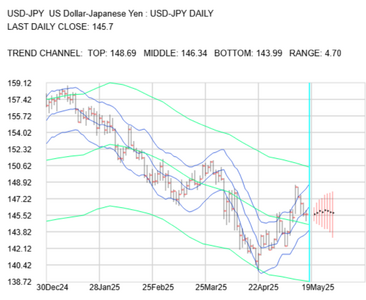
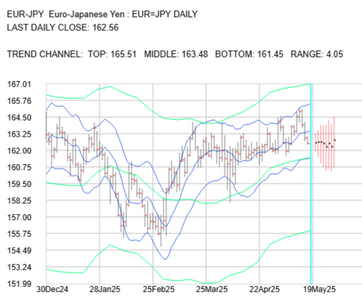
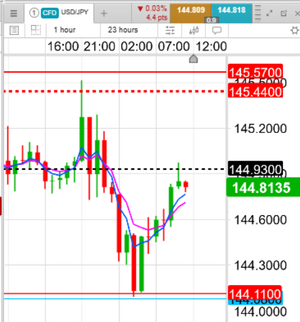
EURUSD X USDJPY = EURJPY
So the maths analysis has to be consistent for all three FX pairs.
Do you use your Elliott Wave analysis on these 3 FX pairs to check consistency? Elliott Wave analysis on three FX pairs would show you which FX pair is leading, following or just standbying.
So I have attached the three VRMFX charts showing the STTC and LTTC for these three FX pairs.
When the FX pair is bearish the price action is below the middle of the trend channel. And when the FX pair is bullish then the price action is above the middle of the trend channel.
So the charts let you read off whether the FX pair is bullish or bearish in the short and long term by looking at where the price action is relative to the middle of the STTC and LTTC respectively.
EURUSD started the week short and long term bearish below the middle of its STTC and LTTC. The middle of its STTC today is 1.1196. The middle of its LTTC for the week is 1.1207.
So to reach your target of 1.14048 for EURUSD the EURUSD will have to find support on the middle of its STTC and LTTC.
You can carry out the same analysis for the USDJPY and EURJPY.
gka