You are using an out of date browser. It may not display this or other websites correctly.
You should upgrade or use an alternative browser.
You should upgrade or use an alternative browser.
barjon
well spotted.
trouble is I dont know how much more, if any.
I think I have set out some 'milestones' or things to look for
but only the market can really decide how much more.
may be worth you going over those milestones ?
I'll check them myself, but I think they are all there.
real support is back around 180 and even then the trend could still be intact.
single stair treads are very interesting country.
edited this line as I don't know who reads these posts and
have no wish to tempt fate.
lets hope the commentators dont spoil things.
Last edited:
This is the original 1 minute chart
macd tracks pretty well
never went anywhere near zero at lunch time and picked up pretty quicklywhen it needed to.
well set above the 1 day sma which did not get touched.
even yesterday the short break was quickly reversed.
edit : Don't forget the comments remain static but the chart
gets updated. so if you read this message too late, the chart will have changed.
<img src="http://chart.neural.com/servlet/GIFChart?sym1=ls:ukx&cbcku=FFFFFF&cbckl=EBF5FF&cbckd=cccc99&ctxtu=000000&ctxtd=000000&ctxtl=000000&csym1=000099&csym3=000000&cbckg=FFFFFF&cind7a=FF0033&cind7=009900&cind8=blu&cind9=6666CC&avg1=60&avg2=510&ind7=macd&periodMACDLow=510&periodMACDHigh=60&height=350&width=450&source=SP&multipane=1&watermark=splogoblue.gif&dres=min&plottype=range&ignore=1220025226&dperiod=days&coname=1&image=PNG">
Last edited:
Bonsai and Barjon.
I know its easy to look back and pretend we have projected targets.However I noticed yesterday,that we had a H&S on my "Bigtrends" 10 day chart with a target of 4285 and to day it achieved this within a nat's whisker.I only mention this because it may give food for thought for next week.This is also a 0.786 retracement of 4080/4330 .
I would also mention,when I noticed this,no way did I think it would get to 4280 and was out mowing the back lawn at the time.!!!.
PS. Bosai,could you please put your Pinnacor chart at the top of page one again,I was using this daily.Thanks.
Last edited:
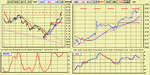
here are some of my charts for the last couple of days.
Things to think about ?
1-apex of trend lines almost upon us.
2-I am calling today the C leg of the rally.
3-The action of the macd which I have ringed.
4- Nice conflict in signals between my RSI and Macd ?
After watching the Dow for a while this evening I have taken what was on offer and closed for the weekend.
The rally may or may not be over. There is no way on earth to be sure one way or the other, whatever people might say.
We will have to wait and see.
At the moment on Ftse, the 'rapid climb' to the top is still ongoing.
BUT
One feature of elliott I have not talked about is 'Alternation'.
This tells us to expect alternating patterns in corrections.
As the 2 wave of 'C' was almost a full pull back, wave 4 should be a flat. As you will see, the movement after 11 am today was flat.
So the 5 legs this afternoon may mean we have a top.
Can't be sure until we see the action on Monday.
Attachments
Last edited:
Fluke
I have decide not to put that chart in the header as it means
people continually refreshing the page (every minute) to get
an up to date chart.
If a number of people do that I suspect it may still be an issue for
sharky's servers.
So what I did was to make a file available for download,
with auto refresh in it, so they could both use it on their own
machines and change the indicators if they wish.
The file automatically refreshes every minute.
Sorry about that.
btw, we havent heard from Lambchop in some time.?
here is the file.
Attachments
barjon
Legendary member
- Messages
- 10,752
- Likes
- 1,863
bonsai
all seems intact (as if I'd have the temerity to disagree with you
anyway!!) A few musings to add to the picture:
Long Term: After a couple of false starts (11/01 and 10/02)
Coppock has turned up significantly since March but we're
approaching crunch time if it's really a new bull trend.
1. we're smack in the area of long term downtrend line running
from 9/00 (log scale) after one retreat from it 19/9 (maybe).
2. Fib 50% resistance @ around 4328 (eod) on the move
from 12/01 to 3/03.
Medium Term: resistance nearby as approaching bottom
line of previous channel - around 300/310 depending on where
lines are drawn.
Short Term: the last 3 candlesticks are very strong and their
bases should provide support. The base of Friday's @ 209 is
co-incident with Fib 38 of the 3 day up move and it will be a
significant breach if it goes.
Of my ftse 14 I've got 2 upward break outs, 6 sitting at or near
resistance, 3 in intermediate down trend and 3 somewhat
indeterminate. Make of that what you will!!
As usual it'll do what we see, not what we guess.
cheers and good trading
jon
Last edited:
Bosai.
Down loaded chart Ok and it's refreshing,I agree with reason for this.
The H&S is the same one you spotted and show on your chart 3/10at 14.30. with target you projected and will admit,you were there before me.
I was long with HBOS and RBOS and closed these on Fri with a small profit,am looking forward to next week.
Am looking at your "Things to think about"
Dont know what's happened to lamb chops but I like your thread,so keep it going.
Have a nice week end and keep out of the horse road.
barjon
Legendary member
- Messages
- 10,752
- Likes
- 1,863
fluke
maybe better amend your last to barjon or the Governor
will get really confused!!
I add avz to the 14, some say it tracks ftse, but I find it often
leads. Mainly I swing trade individual shares with ftse secondary -
at least it used to be like that but this thread has me paying
more and more attention to ftse of late (coupled with a series of
confusing changes in intermediate trend as far as shares are
concerned)
jon
barjon.
Your last post at 03.34.
I have the same thoughts.I had no intention of trading the ftse and was trading blue chips.But find I have done some small SB trades on the ftse and quite like it,so am now looking at trading shares and the ftse.
It's really down to the governor I think he's magic,will amend when you have read this so he does'nt get big headed.
Barjon
😆
I have a feeling you are a lot better at this than you admit to.
very good stuff.
I run a coppock chart as well and have noticed its uptick.
I have it higher than the last signal even though we are still
about 1000 pts lower !(about -50 on mine)
Although I remain bullish, I am worried by the long term a/d line.
We are still below what it was last November when we were at 4230.
But its about the only active negative on the Index that I can see at the mo.
(I don't have log scale graphs.)
Not all that happy about some FT100 stocks.
Azn is struggling with its 50%; BT about to crack ?;Vod holding on
for dear life ?
Retails may have topped;Oils look poor.
Oh dear. No wonder I am the only bull in the field.
But as you imply, the market will do what it needs to do.
And nobody can forecast its future direction.
Fluke
In fairness , it wasn't my chart.
It belongs to a mate on another board.
I dont hunt for H&S, as the indicators I use tend to take me in the right direction anyway.
I also suspect there are more failed H&S than successful ones.
It's just they don't get advertised. But I could be wrong.
I think you're magic too !
😱
thanks , mate.
glad the file is working.
will someone tell Norm88 ?
Similar threads
- Replies
- 12
- Views
- 19K