You are using an out of date browser. It may not display this or other websites correctly.
You should upgrade or use an alternative browser.
You should upgrade or use an alternative browser.
hungrybear
Active member
- Messages
- 209
- Likes
- 0
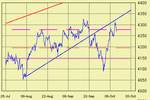
I have the 23% fib at about 4267.
However the Ftse's hit and bounced off the 76% retrace of the move up from the low on the 7th.
However the Ftse's hit and bounced off the 76% retrace of the move up from the low on the 7th.
I'm sure your right hb.
its just that I dont use that fib
just 38/50/62 as they seem to provide the best trading opportunities.
I am working now on 4316/4082, assuming the whole of the abc is now complete.
for example you say we have hit 76% but have you gone long as a result ?
(can't see any indications of a mood change, myself)
hungrybear
Active member
- Messages
- 209
- Likes
- 0
Yes I am long. My other time indicators suggest a high tomorrow, retrace Mon/Tues (Tues turn day?) then a higher high on Thurs/Fri next week.
Mind you, it's the kiss of death when I predict the market 🙄
Mind you, it's the kiss of death when I predict the market 🙄
barjon
Legendary member
- Messages
- 10,752
- Likes
- 1,863
mornin' all
yesterday's gravestone doji will only be negated by a strong
upward close.
can't help thinking there's a lot of safety first about because
so many are forecasting a major down in the DOW. our bulls
out in the morning, then protecting their positions after lunch
and standing on the sidelines to watch how DOW performs.
wonder if traded option volumes say anything?
hungrybear
Active member
- Messages
- 209
- Likes
- 0
I also prefer to look at intra-day highs & lows rather than eod. After an early morning drop, as yesterday, we didn't break yesterdays low, but obviously went higher, so I count yesterday as a positive day despite the negative eod. I'm expecting 3 days up, so we should make a higher high today and tomorrow. If we don't I'll review my analysis.
General point to lurkers: Please bear in mind that I'm not a very experienced trader, so whilst I'm happy to share my analysis please don't dont base your trades on it!
General point to lurkers: Please bear in mind that I'm not a very experienced trader, so whilst I'm happy to share my analysis please don't dont base your trades on it!
hungrybear
Active member
- Messages
- 209
- Likes
- 0
The same analysis applies to the Dow (see my previous post), so unless the Dow breaks yesterdays low I'll remain bullish and expect new highs there as well.
FWIW, I have a target of 1068/9 for the S&P. Then all hell to break loose on the downside.
FWIW, I have a target of 1068/9 for the S&P. Then all hell to break loose on the downside.
Last edited:
hungrybear
Active member
- Messages
- 209
- Likes
- 0
Thanks Bonsai,
I'll be happy when it takes yesterdays high out to confirm my expectations. At least it's broken into what would have been wave 1 down and the trend line across yesterdays high points. Need to see more upside now to gain confidence.
I'll be happy when it takes yesterdays high out to confirm my expectations. At least it's broken into what would have been wave 1 down and the trend line across yesterdays high points. Need to see more upside now to gain confidence.
fell into the trap of talking the market down !!!
naughty , naughty.
but of course now, its simple.
we have had an abc from the high.
so the question now is, is the correction all over or is this the B leg of ABC. ?
I think it looks like a 'B' and structurally weak.
naughty , naughty.
but of course now, its simple.
we have had an abc from the high.
so the question now is, is the correction all over or is this the B leg of ABC. ?
I think it looks like a 'B' and structurally weak.
Fer cryin out loud! You want a SCALE too.
😆 😆 😆 😕 😕 😎 😎 😆
I don't know what you are using to save that pic as a bmp chart
but it's real weird, man !
Similar threads
- Replies
- 12
- Views
- 19K