You are using an out of date browser. It may not display this or other websites correctly.
You should upgrade or use an alternative browser.
You should upgrade or use an alternative browser.
Not sure about Damon Runyan but Trollope was a novelist???I think? Probably not the best person to suggest a
novel to. Can't stand them. Well maybe can't stand them is too strong a word(s). I unfortunately have a dislike for reading or so I thought until I discovered non-fiction.
novel to. Can't stand them. Well maybe can't stand them is too strong a word(s). I unfortunately have a dislike for reading or so I thought until I discovered non-fiction.
barjon
Legendary member
- Messages
- 10,752
- Likes
- 1,863
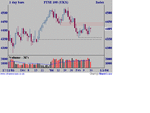
seems a good thing i was out today
finished up with a hanging man (not on yours bonsai :?: ) which
is maybe not very significant after just the one up day.
volume may be of greater interest since a down during the day,
closing on highs on low volume is supposed to be a sign of
strength to be followed by an up move :?: or is that just another
old wives tale 🙂
Attachments
barjon
Legendary member
- Messages
- 10,752
- Likes
- 1,863
bonsai
no - hanging man has a long lower shadow (at least twice the
length of the real body) and no, or a very short, upper shadow.
same as a hammer.
the small body, long upper shadow and no or lttle lower shadow
is a shooting star.
strictly, all need confirming by next day's action.
to be valid a hammer should appear at the bottom of a down
trend and the hanging man at top of an uptrend. it's doubtful
that one day could be considered a short uptrend so you're
probably right to think of it just as an inside day.
i bet you knew all that really, but it's nice to be giving rather than
taking for a change. lol.
ps: what about the volume and the old wives tale?
Last edited:
if I follow you correctly then a hammer and a hanging man look visually identical ?
volume / old wives tale ? 😆 you plagiarist, you !
I don't have your confidence in volume as reliable indicator.
That's not to say it isn't, it's just my prejudice.
Happier to notice that we finished above that pretty number and above my fan line. RSI has turned up and Macd is now > zero.
That's four reasons. Oh yes and above Hooyas triangle top line.
So that makes a handful ! 😆
Mind you the next fan line is not that far away at 4420+
<img src="http://stockcharts.com/education/glossary/Images/gloss-hammer.gif">
The price action that creates a candlestick of this shape indicates that the bears drove the price down during the day, but the bulls were able to mount a rally by the end of the day and the close was relatively strong. If the candlestick is white, indicating that the bulls were able to rally the stock above the opening level, then it is considered more bullish than if the close is below the open.
If this candlestick forms after a decline, then it is called a hammer. This is much like a washout day with a reversal -- The market is trying to hammer out a bottom. The hammer by itself is not a bullish signal, but rather serves to notify traders that the bears are weakening and the bulls are gaining strength.
If this candlestick forms after an advance, then it is called a hanging man. Even though the bulls won out by the close, this candlestick should serve as an alert to potential weakness.