Best Thread Firewalker's Journey: A path of discovery in search for enlightenment

Status
Not open for further replies.
ymonly said:
db, early recognition of apex bar as it closes .......is that worth pursuing? thanks

Yes. The earlier you can get in, the tighter your stop can be. However, one must study a hell of a lot of these "bars" (actually parabolic waves) in order to achieve a satisfactory -- for him -- probability of being right. He must avoid being sucked into a counter-trend trade. He should be open to the possibility of an SAR but not be tricked into exiting his original position too early.

So, whether one tries this tactic and benefits from it will depend on how much research he's willing to do.

Db
 
dbphoenix said:
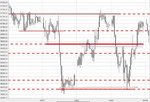
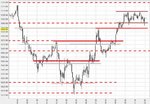
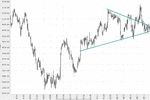
As for the adjustments, your lines should be consistent from left to right. You have what appears to be an important line on your first chart at 5625, but this then disappears. The adjustment I made was to 5612.5, which is echoed in the line you drew on your second chart at 5615, which seems to come out of nowhere, but is based -- or should be -- on the S/R line drawn on the first chart. As for the line drawn at 5675 on the second chart, this is drawn by you on the first one, but left off the second one, and extending that line underneath that first swing low to 5675 strengthens the potential importance of the line. 5675 is also left off your third chart, even though, again, you drew it on your first.
Db

You're absolutely right that was not consistent, but let me explain. I decided to see where I would draw S/R lines on each chart separately. Any lines I believed to be there were marked independently of what I saw on the chart of the previous week and month with the purpose to see if I'd were able to mark similar points. Apparently not... I do have however a question about consistency: 5675 seems an important level, than shouldn't the line on the monthly (first) chart to the left be situated around 5675 instead of 5662.50? Furthermore on the (third) daily chart you drew a line at 5650, although there is no reference to that on the other charts so this one does come out of nowhere?

Finally, are the grey lines meant to indicate zones or did you have something else in mind?
 
firewalker99 said:
You're absolutely right that was not consistent, but let me explain. I decided to see where I would draw S/R lines on each chart separately. Any lines I believed to be there were marked independently of what I saw on the chart of the previous week and month with the purpose to see if I'd were able to mark similar points. Apparently not... I do have however a question about consistency: 5675 seems an important level, than shouldn't the line on the monthly (first) chart to the left be situated around 5675 instead of 5662.50? Furthermore on the (third) daily chart you drew a line at 5650, although there is no reference to that on the other charts so this one does come out of nowhere?

Finally, are the grey lines meant to indicate zones or did you have something else in mind?

The following represent what I would have done to prepare for the 4th and what I would have drawn during the trading day on the 4th. It is not THE way. It is A way. It provides me with focus but not blinders.

5650 is not drawn on the first two charts because I would have seen nothing in the first two charts to suggest that 5650 was important.

The grey lines are those that you drew which I adjusted or did not use.
 

Attachments

  • Image3.jpg
    Image3.jpg
    55.9 KB · Views: 311
  • Image4.jpg
    Image4.jpg
    49.1 KB · Views: 253
  • Image5.jpg
    Image5.jpg
    52.1 KB · Views: 278
dbphoenix said:
You may have the following clear in your head, but they're not clear in what you have written:
Db

Please find the replies to your questions:

1) What is "near"? A point? Two? 5%? 10%? Are you shorting all your contracts at once?
Near = exactly to that point
Entering a trade is immediately with two contracts, exiting is done following fixed targets based on ATR as described.

2) Again, retrace how close? Short more contracts? How many?
Retracement to that same level, so exactly as it reaches 5690. For the moment I'm not adding to a position nor averaging down. So if I were to be in a trade that would be one going in the right direction and I'd leave it alone. If I wasn't in a trade at that time, I'll enter now.

3) Ditto re "retrace" and "short". "Wider" than what? How many is "a lot"?
For "retrace" and taking on a position I refer to my answer on point 2.
Wider = spread at least double than the down bars before.
A lot is at least 3.
"unless you see wider spread up bars or a lot of up bars closing near the high"
should have been: "unless you see a min 3 wider spread up bars closing near the high"

Because you already found my "plan" fairly complex, I didn't want to add to that be specifying further details...

dbphoenix said:
If this is not clear, post your prep and charts for Monday, but give people enough time to comment. Today would be good.
Db

I'll see what I can do but my broker doesn't allow access from Saturday till Sunday evening (system updates,..)
 
dbphoenix said:
The grey lines are those that you drew which I adjusted or did not use.

Sorry, I knew those were mine, I just wondered if you had any special intention by putting them grey instead of removing them from the chart. No problem.
 
firewalker99 said:
Please find the replies to your questions:

1) What is "near"? A point? Two? 5%? 10%? Are you shorting all your contracts at once?
Near = exactly to that point
Entering a trade is immediately with two contracts, exiting is done following fixed targets based on ATR as described.

2) Again, retrace how close? Short more contracts? How many?
Retracement to that same level, so exactly as it reaches 5690. For the moment I'm not adding to a position nor averaging down. So if I were to be in a trade that would be one going in the right direction and I'd leave it alone. If I wasn't in a trade at that time, I'll enter now.

3) Ditto re "retrace" and "short". "Wider" than what? How many is "a lot"?
For "retrace" and taking on a position I refer to my answer on point 2.
Wider = spread at least double than the down bars before.
A lot is at least 3.
"unless you see wider spread up bars or a lot of up bars closing near the high"
should have been: "unless you see a min 3 wider spread up bars closing near the high"

Because you already found my "plan" fairly complex, I didn't want to add to that be specifying further details...

Better, and this stuff seems complex only because it's written down. As the weeks and months and years go by, most of it becomes automatic, like braking at a red light. (My reference to "complex" had to do with the multi-layered smorgasbord approach which you had posted earlier.)

Even so, I see nothing about longs in your plan, exc for your note about price breaking above 5710, which it never did.


I'll see what I can do but my broker doesn't allow access from Saturday till Sunday evening (system updates,..)

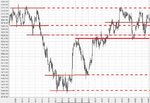
You don't have access to charts except through your broker?

Db
 
dbphoenix said:
You don't have acces to charts except through your broker?
Db

No, any idea on a free data provider?
I do have a tool for backtesting (Trademaven) with which I can replay days up to three months. I've found this to be quite useful as you also can fast forward throughout the day. Unfortunately it doesn't include DAX. Any views on trading a specific market in particular? Like if I'd were to be a ES trader, would I study only ES charts?
 
Last edited:
dbphoenix said:
Even so, I see nothing about longs in your plan, exc for your note about price breaking above 5710, which it never did.
Db

Well, I mentioned several possible entries for taking a long position in points 2 and 3 of my plan. But I think we'd better stick to the first part. For longs exactly the same is valid, it would be just in reverse (instead of resistance line, it would be a support). But otherwise all the same variables would be included with the same rules, but then upbars would be down, and so on... if you think it would be safer to write it out completely let me know.
 
firewalker99 said:
Well, I mentioned several possible entries for taking a long position in points 2 and 3 of my plan.

I see nothing here about longs except in the asterisked portion of (2):

1. Pre-market: I attached a chart of previous month (1day bar), week (30min bar) and day (5minbar) with S/R lines.

2. After the open:
- when near 5710 short
- if price drops below previous S 5690 wait for it to retrace up to the line, then short again
- if price drops below Support 5670 wait for it to retrace, then short if selling volume was still high enough (not after probable selling climax)

* In case price breaks up through 5710 on high volume bozo, wait for next bars and try to enter long around 5710 if you see the signals as described in "1". Than wait and see what happens if it reaches previous resistance around 5737.50. Anyway, that's where points 4 & 5 come into play.

3. Stop: my stop will be placed at ATR. So depending on the volatility at the time of entry, stop can be small or large. Why? I don't want to get stopped out to early.

4. Target: if I trade two contracts the first target is 2x ATR, second is 3x ATR.
Why? I think is risk:reward of 1:2 or 1:3 is not aiming too high. If I'm unable to take small profits, I don't think I'll ever be able to take big profits.

5. Exit: After my first target is reached, I'll place my stop to breakeven. So either I'll exit on BE or on 3x ATR with second contract. If first target isn't reached, than both contracts will be out on the stoploss.


But I think we'd better stick to the first part. For longs exactly the same is valid, it would be just in reverse (instead of resistance line, it would be a support). But otherwise all the same variables would be included with the same rules, but then upbars would be down, and so on... if you think it would be safer to write it out completely let me know.

If writing it all out before the trading day opens is not helpful, then there's no particular reason for you to do it.

So far, 95% of this has been theoretical. I suggest you spend a few weeks trying out the suggestions I and others have made in order to determine whether or not those suggestions have any effect on your success rate or not.
 
August 7: Preparation before the day

* Changed JPEG charts into GIF for smaller file sizes.
* Added 6 month chart because no S/R lines visible above 5750 on smaller time frames.
* Removed line at 5662.50: didn't see anything at weekly chart. Not sure about 5650 either.

Note: last week price has been ranging between 5625-5725 with a peak 5750 at time of ECB interest news release.
:!: Possible outbreak above 5750
 

Attachments

  • daxmonthly1.GIF
    daxmonthly1.GIF
    67.2 KB · Views: 231
  • daxweekly1.GIF
    daxweekly1.GIF
    38.2 KB · Views: 213
  • dax6months.GIF
    dax6months.GIF
    50.5 KB · Views: 218
Last edited:
August 7 plan

Possible trades after opening:
* Entries long after retrace (cfr. plan) above 5720, 5750, 5800
* Entries short after retrace (cfr. plan) below 5675, 5625, 5612.50, 5600

Conditions to enter short: previous posts
Conditions to enter long:
Look for outbreak through previous resistance level (in this case 5750) on WRB which closes above middle (preferably marubozu). Wait for price to retrace to that same point. Pattern down should be less pronounced than breakthrough and should not be a bounce off another higher resistance level (5800) which could indicate reversal. After first trade was successfully closed, check if market is trending (higher highs + higher lows or opposite) or ranging (hi/lo remaining within specific boundaries) and look for possible entry around 5750/5800 levels.

No change in rules for position sizing, risk/reward, exit, stoploss.
 
Last edited:
August 7 Trades

No entries.
Red lines indicate S/R lines previous to opening, blue lines added throughout the day

Signal 1: 1100hr, breakthrough S 5650 on WBR
Seems like bounce off on 5635 however, so in doubt => not a retracement
"when in doubt, stay out" -> did not short at return to 5650
another counterindicating signal: WRB at 1145hr

Signal 2: 1700hr, again breakthrough S 5650 on WBR
contra-indicating signals: WRB around 1730
+ looks like reversal and bounce off 5635 once again

no clear breakthroughs on upper R level
:?: strategy needed for reversals
 

Attachments

  • 20060807-a.GIF
    20060807-a.GIF
    50.6 KB · Views: 242
August 8 preparation

* Same charts and S/R lines as August 7
* Note hinge? :!:
* Possibility for slow moving day within small range 5650-5675? pretty small range...
* More likely: outbreak, perhaps surrounding 2015 local time (FOMC Interest Rate Statement)
 

Attachments

  • daxhinge20060808.GIF
    daxhinge20060808.GIF
    51 KB · Views: 223
Last edited:
August 8 Summary

* Only one possible entry according to plan: after breakthrough at 1430 waited for retracement back to 5675 which happened at 1600. "Retracement" however happened at multiple WRB which was a counterindicator, so didn't take the trade.

* Did no more trading after 2000 local time (FOMC Interest Rate Statement)

* Added S/R lines from previous day @ 5635
* New R at 5695? (already occured at intraday chart couple of days ago)
 

Attachments

  • 20060808-a.GIF
    20060808-a.GIF
    44.6 KB · Views: 222
  • dax2day.GIF
    dax2day.GIF
    47 KB · Views: 215
Last edited:
firewalker99 said:
* Only one possible entry according to plan: after breakthrough at 1430 waited for retracement back to 5675 which happened at 1600. "Retracement" however happened at multiple WRB which was a counterindicator, so didn't take the trade.

* Did no more trading after 2000 local time (FOMC Interest Rate Statement)

* Added S/R lines from previous day @ 5635
* New R at 5695? (already occured at intraday chart couple of days ago)

I see nothing here about multiple WRBs being a counterindicator. How do you know that that's true?

Ok, I'll share some essentials of my trading plan for taking an entry.
They are however based on S/R lines or trendlines; that's where I fail to make it. Often in hindsight I see other points that indicate a better support zone, and if I'd taken my entry conform strategywise that would have been a possible profitable trade. This part doesn't say anything about position sizing, risk reward, profit/loss, fixed or variable target, stoploss, etc. If you'd want me to add let me know but perhaps it's better to take it one step at a time.

1) If a break through a previous resistance level should occur on a wide range body (closing above middle, this does not necessarily imply one bar try to "blend" bars), check if volume is equal or higher than the previous upswing. If it is (but not extremely high because that would indicate too much supply), than wait for a retracement (lower volume, small spread) to touch the resistance line. If it waffles around or slightly above the line for a minimum of three bars on lower volume (possibly dry-up), than take an entry. Also check for support to the left of the weekly/monthly chart if the marubozu upbar didn't create an air pocket without support.
In case of a support line -> similar situation but turn everything around

2) After a potential selling climax (of course easy to say in hindsight, although I have described some elements where too look for), look for a high volume wide spread hammer that closes above the low of the previous wide spread down bar (sometimes you'll have to "blend" two bars to see it). If price slowly starts to move up than wait for it to go back very near or to the lowest point of the SC. On that point if you see three bars that have an end above the middle, place your long entry.

3) Once you see a triangle (coil, hinge,...) developing check what happened before. This should be a low volume move converging into a point in the future. If after a selling climax, enter long on one of the lowest points, then if a false outbreak would occur you'd still be breakeven. If price has been ranging before, then if price > opening price => go long on lower boundary, otherwise short on upper side
.

Are you not trading today?

Db
 
dbphoenix said:
I see nothing here about multiple WRBs being a counterindicator. How do you know that that's true?

Are you not trading today?

Db

That's from post #107 where you asked me to specify some points:

3) "Wider" than what? How many is "a lot"?
For "retrace" and taking on a position I refer to my answer on point 2.
Wider = spread at least double than the down bars before.
A lot is at least 3.
"unless you see wider spread up bars or a lot of up bars closing near the high"
should have been: "unless you see a min 3 wider spread up bars, closing near the high"


In this particular case I saw 3 wide spread upbars, of which two about 10 points in size and closing on the high or very near to it. I don't know if that's true, but for me that would look more like a reversal instead of a retracement, especially as it went all the way back to S/R in only three bars...

No, not trading "as usual" today, as for now I fail to see what good it's going to do be analyzing the chart in real time. By the end of the day I'll review it and scroll "bar-by-bar"...
 
firewalker99 said:
That's from post #107 where you asked me to specify some points:

3) "Wider" than what? How many is "a lot"?
For "retrace" and taking on a position I refer to my answer on point 2.
Wider = spread at least double than the down bars before.
A lot is at least 3.
"unless you see wider spread up bars or a lot of up bars closing near the high"
should have been: "unless you see a min 3 wider spread up bars, closing near the high"


In this particular case I saw 3 wide spread upbars, of which two about 10 points in size and closing on the high or very near to it. I don't know if that's true, but for me that would look more like a reversal instead of a retracement, especially as it went all the way back to S/R in only three bars...

No, not trading "as usual" today, as for now I fail to see what good it's going to do be analyzing the chart in real time. By the end of the day I'll review it and scroll "bar-by-bar"...

As you say, "I don't know if that's true". If you had tested the setup, you would know whether it's true or not. But you can't test the setup until you define it clearly enough to recognize it when you see it.

And, no, given the above circumstances, it's not going to do you much good to analyze the chart in real time. However, waiting for the EOD to review it is the equivalent of bailing out a sinking ship with a teaspoon. There are millions of old charts available. Why are you not looking for your setup in those charts in order to determine whether or not it is a winning setup?

Db
 
dbphoenix said:
As you say, "I don't know if that's true". If you had tested the setup, you would know whether it's true or not. But you can't test the setup until you define it clearly enough to recognize it when you see it.

And, no, given the above circumstances, it's not going to do you much good to analyze the chart in real time. However, waiting for the EOD to review it is the equivalent of bailing out a sinking ship with a teaspoon. There are millions of old charts available. Why are you not looking for your setup in those charts in order to determine whether or not it is a winning setup?

Db

I thought I was in the process of testing it? None of the things I've written are "true" or "false" as it's the first time I'm testing this particular setup using S/R lines from the previous week/month on the chart of the day as you recommended.

Before I only tested with S/R lines of the previous day. I've used Trademaven on ER2 to check and see if there was something in it, going back couple of months with replay function. Most of the time I didn't find usefuls setups, as seems to be the case here again. When I did found one either my stop was triggered or the trade never reached my target before turning back to breakeven. Of course there were succesful ones also, but you could count them on one hand.

I'm looking for something which would allow me 3 to 5 trades a day instead of 3 to 5 a week. I don't have access to intraday DAX charts of previous days (unless for the ones I've saved myself) unfortunately...
 
Status
Not open for further replies.
Top