dbphoenix
Guest Author
- Messages
- 6,954
- Likes
- 1,266
firewalker99 said:Well eh, because my broker has no backfill and I don't have a free data provider...
And how much money have you lost so far?
firewalker99 said:Well eh, because my broker has no backfill and I don't have a free data provider...
Don't really see the relevance in posting that on a public forum.dbphoenix said:And how much money have you lost so far?
dbphoenix said:What I'm suggesting is that you've been penny wise and pound foolish. While trying to save money, you've been trading without a setup, you haven't done any testing, you haven't developed a trading plan. This route has wound up costing you far more than you would have spent on access to historical intraday FDAX charts. Even so, when I ask why you haven't done the backtesting, you respond that your broker has no backfill and you don't have a free data provider.
If you want to be a winning trader, you at the very least have to do what winning traders do, and that, at a minimum, means putting together a trading plan, and putting together a trading plan requires, at a minimum, access to historical charts. If you want to collect these charts day by day for a year or more for "free", that's up to you. But if you want to get on with it, I suggest you subscribe to Sierra Charts, which costs less than $20/mo and which can use IB as a free datafeed, if you have an account with IB. If you don't have an account with IB, I suggest you get one.
Db
dbphoenix said:In order to answer your question, I'd have to know what your backtesting consists of and what the results are.
Db
dbphoenix said:FW, what I would like to see is of no importance whatsoever. What is important is whatever puts you into the black.
If you've read the threads below on trading plans and trading journals, plus the posts in the PV and S/R threads, and you think that backtesting consists of "replaying the day with fast forward", then I have to cry Uncle.
Best of luck to you in your trading.
Db
rainman2 said:Hi fw,
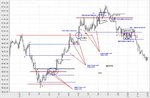
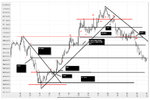
Here's a different take with a lot of hindsight analysis. I would actually like to here opinions about wide range bodies as s/r zones.
wasp said:I hope you don't mind me taking the libety of posting this. From the little DAX data I have this may not work but an option from my point of view for a strategy you could look at and maybe work with?
As you know my PA knowledge is limited and I'm sure the more exerienced could voice their opinion of the validity of the approach and I think volumes may help you too but its an idea?!
wasp said:Bit busy at the moment FW, I'll get back to you tonight.
ymonly said:too much information ......sometimes we need to totally delete everything except the very best discoveries and start over.........or just use the very best discoveries and the least # of those we can get by with.......1 chart.......1 time frame...is good...looking at other stuff also for confirmation is simply looking for excuse not to trade...... confirmation is another way to avoid the pain of losing again... nq es ym er ......
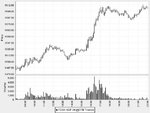
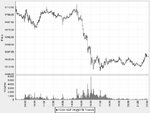
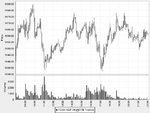
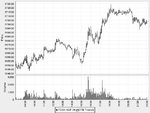
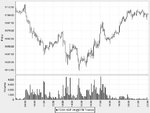
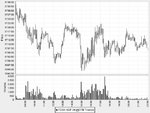
firewalker99 said:as you requested, some blank dax charts including volume
some are definitely trending, others ranging days..
have a go 🙂