Best Thread Firewalker's Journey: A path of discovery in search for enlightenment

Status
Not open for further replies.
firewalker99 said:
Do you mean it's all crap I wrote? :eek:
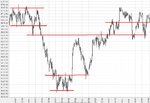
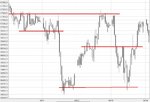
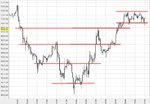
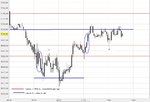
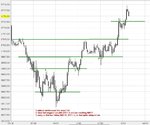
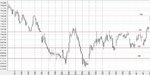
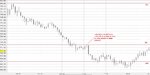
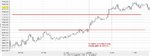
I'm not sure in what direction a trading plan should look like then... I've seen examples, people saying "if I see two shadows above a resistance line, I'd short", if I see a shooting star after high volume down bar I'd short, stuff like that... I was just trying to sort out something for myself and I've assembled some screenshots where my entries do actually work. But it's not a guarantee for success, but then again, no strategy works for every trade right?

No, it's not crap. It's all part of the process. And everything you've read and everything you've heard and everything you've tried will be used in some way at some point. Nothing is wasted.

However, now it's time to put it all together into something that works for you. Looking at the examples of others is fine as far as that goes, but what works for somebody else is not likely to work for you because it won't be yours. And, no, not every trade will yield a profit. However, that doesn't mean the strategy is at fault. But the strategy has to yield a consistent profit over time or it's not worth using.

Could you perhaps give me a hint about what a plan should look like then?
As for your suggestion, I'll start doing that tomorrow and leave volume out of the equation as you also suggested. To be honest, I'm not sure how I'm going to place an entry with leaving all this in the trashcan, only using S/R and not using any theorie. Seems like throwing darts at a cheesecake...

Don't put it in the trashcan, then. Just set it aside and focus on one thing. Try whatever seems most logical of everything you've tried so far.

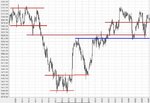
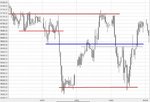
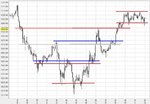
As for the plan, you've made a good beginning, but it's very complex. Have you tested all of that? Take your "1", for example. Does that tell you exactly what to look for? If so, you'll at least be plotting potential S/R levels. You'll also be posting the previous day's, week's, month's chart. Then, according to what you've written, you'll be waiting for a WRB. Translate all of that into specific actions. Then, when the trading day begins, all you have to do is wait for the conditions you've specified. You don't have to guess. But you have to specify first (see my last post). That's part of the plan.

If you want comments, post this at night in order to give people plenty of time to look at it and ask their questions or offer their suggestions.


Db
 
dbphoenix said:
If you want comments, post this at night in order to give people plenty of time to look at it and ask their questions or offer their suggestions.

Db

Well, as I'm in quite a different time zone as you are, I'm not able to post it at the evening because that would mean the middle of the night here in Belgium
:)

I invite everybody to give me their comments, whether it's on a chart from a couple of days ago doesn't matter, I don't expect to have immediate responses although I appreciate any "live" feedback.
 
August 4 - taking it from the beginning

As Dbphoenix suggested, I'll begin today by stating charts, entries, stop, targets, exits.
It's all very basic, because I want to avoid having endless discussions back and forth. Let's focus about essentials, if I'm unable to get that right, no use in letting myself slip away in the details.

1. Pre-market: I attached a chart of previous month (1day bar), week (30min bar) and day (5minbar) with S/R lines.

2. After the open:
- when near 5710 short
- if price drops below previous S 5690 wait for it to retrace up to the line, then short again
- if price drops below Support 5670 wait for it to retrace, then short if selling volume was still high enough (not after probable selling climax)

* In case price breaks up through 5710 on high volume bozo, wait for next bars and try to enter long around 5710 if you see the signals as described in "1". Than wait and see what happens if it reaches previous resistance around 5737.50. Anyway, that's where points 4 & 5 come into play.

3. Stop: my stop will be placed at ATR. So depending on the volatility at the time of entry, stop can be small or large. Why? I don't want to get stopped out to early.

4. Target: if I trade two contracts the first target is 2x ATR, second is 3x ATR.
Why? I think is risk:reward of 1:2 or 1:3 is not aiming too high. If I'm unable to take small profits, I don't think I'll ever be able to take big profits.

5. Exit: After my first target is reached, I'll place my stop to breakeven. So either I'll exit on BE or on 3x ATR with second contract. If first target isn't reached, than both contracts will be out on the stoploss.
 

Attachments

  • daxmonthly.JPG
    daxmonthly.JPG
    173.1 KB · Views: 289
  • daxweekly.JPG
    daxweekly.JPG
    135.7 KB · Views: 267
  • daxprevious.JPG
    daxprevious.JPG
    135.2 KB · Views: 249
So, let me start be getting into detail with the first three trades of the day.
I added S/R lines that formed throughout the day in blue.

"Near 5710 short": didn't happen unless you take in account first bar.

"Price drop below 5690":
- short at 1 following steps in my plan, after breakthrough S on WRB bars.
- stop = ATR = 4 points
- first target = 5682 and second target = 5678 were both hit so I'm out of the trade

After what I believe to be SC, application of same principles:

"Long near 5690":
- Exactly what I've described in my plan "break through a previous resistance level 5690 should occur on a wide range body" then go long on retracement. So at 1100 I went long @ 5690 marked by point 2 (placed a limit order before).
- stop = ATR = 3.5 points
- first target = 5697 and second target = 5701 were both hit so I'm out of the trade

"Long near 5695":
- Same situation actually, although I "blend" the three upbars from just after 1100 together in one WRB that moves through 5695 without hesistation. So after that I placed a limit order @ 5695 that was triggered at 1200
- stop = ATR = 3 points
- first target = 5701 and second target = 5704 were both hit so I'm out of the trade
 

Attachments

  • 20060804-a.JPG
    20060804-a.JPG
    111 KB · Views: 253
I'll try to put this in perspective:

Ok, so 3 trades that easily made it to target profits. But in this case signals were quite clear and a clean trend move. Furthermore, I think I got lucky because of those spikes that just touched my S/R line, in many cases they just hover above without me entering and missing on a profitable trade. On other occasions all S/R are all mixed up. Apart from that, suppose you'd just had to buy on the retest from S in uptrend, or sell from R in downtrend after retest than determining your entry would be piece of cake for everybody, not?

Also I have to note that my basic rule of entering after three bars has been violated through the use of a limit order. In this case it just happened to work out, but if I'd were to follow my plan in detail that would only leave entry 1.

I tried a little experiment: removed all red lines from my chart and looked where I'd draw S/R starting today without reference points. Then looked where I'd enter based on the plan. Check out the difference: would have missed 1st entry, lost out on 2nd and been stopped out on 3rd.
 

Attachments

  • 20060804-wrong.JPG
    20060804-wrong.JPG
    104.6 KB · Views: 270
Last edited:
firewalker99 said:
Well, as I'm in quite a different time zone as you are, I'm not able to post it at the evening because that would mean the middle of the night here in Belgium
:)

By "evening", I meant after your market closes. If you wait until just before your market opens to post anything, you may not get much response.

Db
 
Applying principle 1 (S/R) on ER2

no entries here
but one big uptrend, one big downtrend
so strategy 1 means nothing in a trending day

attached: 1 month chart,
intraday 3 chart of yesterday and today
 

Attachments

  • er2july.JPG
    er2july.JPG
    123.6 KB · Views: 246
  • 20060804-er2.JPG
    20060804-er2.JPG
    104.4 KB · Views: 248
  • 20060803-er2.JPG
    20060803-er2.JPG
    86.2 KB · Views: 211
dbphoenix said:
By "evening", I meant after your market closes. If you wait until just before your market opens to post anything, you may not get much response.

Db

Do you have any other charts with annotations like the red dots that you made?
 
firewalker99 said:
I think I got lucky because of those spikes that just touched my S/R line, in many cases they just hover above without me entering and missing on a profitable trade. On other occasions all S/R are all mixed up.

And in all other such occasions, did you follow exactly the same protocol?

Db
 
dbphoenix said:
And in all other such occasions, did you follow exactly the same protocol?

Db

It's the first time I've used charts from the day/week/month before to draw S/R lines, in all those other occasions S/R lines where drawn throughout the day itself.
What is your impression now that you've seen my "plan"? You may be honest, I'd rather know where I'd stand than beat around the bush.
 
firewalker99 said:
It's the first time I've used charts from the day/week/month before to draw S/R lines, in all those other occasions S/R lines where drawn throughout the day itself.

What is your impression now that you've seen my "plan"? You may be honest, I'd rather know where I'd stand than beat around the bush.

If this is the first time you employed this particular approach, then, yes, you were lucky, even though plotting longer-term S/R may have given you a slight edge, which would make it prepared lucky, which is a higher-class variety. However, if you continue to suspend your trading and apply this approach to, say, 20 days' charts (one trading month), you'll have some indication of the probability of your success, which will give you something more solid to rely on than luck, even prepared luck.

As to your plan itself, I can't say much about it since it incorporated volume and you didn't plot volume on any of your charts or mention it in the account of your trades, so I really don't know if you did what you planned to do or not. Can you clarify this?

Db
 
As to your "context" charts, I did make some minor adjustments, but you seem to have a handle on S/R, so for now I don't see this as an issue.
 

Attachments

  • fw1.jpg
    fw1.jpg
    51.7 KB · Views: 293
  • fw2.jpg
    fw2.jpg
    42.7 KB · Views: 239
  • fw3.jpg
    fw3.jpg
    43.8 KB · Views: 291
dbphoenix said:
If this is the first time you employed this particular approach, then, yes, you were lucky, even though plotting longer-term S/R may have given you a slight edge, which would make it prepared lucky, which is a higher-class variety. However, if you continue to suspend your trading and apply this approach to, say, 20 days' charts (one trading month), you'll have some indication of the probability of your success, which will give you something more solid to rely on than luck, even prepared luck.

As to your plan itself, I can't say much about it since it incorporated volume and you didn't plot volume on any of your charts or mention it in the account of your trades, so I really don't know if you did what you planned to do or not. Can you clarify this?

Db

I'm sorry perhaps I didn't clarify that enough. I left volume completely out of the equation because you asked me to. I didn't only left it out of the chart but I also neglected to even take a look at it. So I removed the references to volume from my plan:

1) If a break through a previous resistance level should occur on a wide range body (closing above middle, this does not necessarily imply one bar try to "blend" bars) then wait for a retracement to touch the resistance line. If it waffles around or slightly above the line for a minimum of three bars, than take an entry. Also check for support to the left of the weekly/monthly chart if the marubozu upbar didn't create an air pocket without support.
In case of a support line -> similar situation but turn everything around

I didn't follow the 'three bars' rule as I placed limit orders and didn't keep my eye on the charts continuously so perhaps I'd have to adjust that one too...
 
firewalker99 said:
I'm sorry perhaps I didn't clarify that enough. I left volume completely out of the equation because you asked me to. I didn't only left it out of the chart but I also neglected to even take a look at it. So I removed the references to volume from my plan:

1) If a break through a previous resistance level should occur on a wide range body (closing above middle, this does not necessarily imply one bar try to "blend" bars) then wait for a retracement to touch the resistance line. If it waffles around or slightly above the line for a minimum of three bars, than take an entry. Also check for support to the left of the weekly/monthly chart if the marubozu upbar didn't create an air pocket without support.
In case of a support line -> similar situation but turn everything around

I didn't follow the 'three bars' rule as I placed limit orders and didn't keep my eye on the charts continuously so perhaps I'd have to adjust that one too...

With regard to volume, I was referring to the following:

1. Pre-market: I attached a chart of previous month (1day bar), week (30min bar) and day (5minbar) with S/R lines.

2. After the open:
- when near 5710 short
- if price drops below previous S 5690 wait for it to retrace up to the line, then short again
- if price drops below Support 5670 wait for it to retrace, then short if selling volume was still high enough (not after probable selling climax)

* In case price breaks up through 5710 on high volume bozo, wait for next bars and try to enter long around 5710 if you see the signals as described in "1". Than wait and see what happens if it reaches previous resistance around 5737.50. Anyway, that's where points 4 & 5 come into play.

3. Stop: my stop will be placed at ATR. So depending on the volatility at the time of entry, stop can be small or large. Why? I don't want to get stopped out to early.

4. Target: if I trade two contracts the first target is 2x ATR, second is 3x ATR.
Why? I think is risk:reward of 1:2 or 1:3 is not aiming too high. If I'm unable to take small profits, I don't think I'll ever be able to take big profits.

5. Exit: After my first target is reached, I'll place my stop to breakeven. So either I'll exit on BE or on 3x ATR with second contract. If first target isn't reached, than both contracts will be out on the stoploss.
 
dbphoenix said:
With regard to volume, I was referring to the following:


[/I]

Sorry, I thought I had edited that post. Should sound like this:

2. After the open:
- when near 5710 short
- if price drops below previous S 5690 wait for it to retrace up to the line, then short again
- if price drops below Support 5670 wait for it to retrace, then short unless you see wider spread up bars or a lot of up bars closing near the high

* In case price breaks up through 5710 on wide spread bozo, wait for next bars and try to enter long around 5710 if you see the signals as described in "1". Than wait and see what happens if it reaches previous resistance around 5737.50. Anyway, that's where points 4 & 5 come into play.

So regarding to volume, I implied wide spread bars.
As for ATR, I did plot it on my screen, but left it out of the charts.
 
Last edited:
dbphoenix said:
As to your "context" charts, I did make some minor adjustments, but you seem to have a handle on S/R, so for now I don't see this as an issue.

Although you call them "minor" adjustments, drawing the line 5 points higher or lower could mean the difference between a profitable trade and a stoploss trigger because my stoploss is normally less than 5 (ATR).

Do you look at the outer edges to draw a line? In many cases I've read it's safer to draw a line within a "congestion zone" instead of the point where it spikes. Do you take in account the wicks, bodies, or say for instance it's more probably to have a zone around 5650 than around 5645 because it's a "round number"... Take a look at post #87, not so long ago, I'd probably drawn S/R on those points.

Take for instance the lower line at 5625, could have drawn it at 5620 or at 5630, I intuitively choose 5625 but if I were to defend my position I could also argue in favour of 5620-5630. I know you say the lines are often more "zones" but trading a zone of a mere 10 points is a too big for me.
 
You may have the following clear in your head, but they're not clear in what you have written:

firewalker99 said:
2. After the open:
- when near 5710 short

What is "near"? A point? Two? 5%? 10%? Are you shorting all your contracts at once?

- if price drops below previous S 5690 wait for it to retrace up to the line, then short again

Again, retrace how close? Short more contracts? How many?

- if price drops below Support 5670 wait for it to retrace, then short unless you see wider spread up bars or a lot of up bars closing near the high

Ditto re "retrace" and "short". "Wider" than what? How many is "a lot"?

And so on, but I hope you get the idea. Questions you ask yourself during the prep phase are questions you won't have to ask yourself when you're trading and have to make an immediate decision.

If this is not clear, post your prep and charts for Monday, but give people enough time to comment. Today would be good.

Db
 
firewalker99 said:
Although you call them "minor" adjustments, drawing the line 5 points higher or lower could mean the difference between a profitable trade and a stoploss trigger because my stoploss is normally less than 5 (ATR).

Do you look at the outer edges to draw a line? In many cases I've read it's safer to draw a line within a "congestion zone" instead of the point where it spikes. Do you take in account the wicks, bodies, or say for instance it's more probably to have a zone around 5650 than around 5645 because it's a "round number"... Take a look at post #87, not so long ago, I'd probably drawn S/R on those points.

Take for instance the lower line at 5625, could have drawn it at 5620 or at 5630, I intuitively choose 5625 but if I were to defend my position I could also argue in favour of 5620-5630. I know you say the lines are often more "zones" but trading a zone of a mere 10 points is a too big for me.

Regardless of what you've read and what I or anyone else has said, you have to determine through your own experience where it's "safer" to draw a line. Keep in mind, however, that price is outside of you, as are the levels of S/R. They exist independent of you, though in the case of S/R levels, you may not place them correctly. Your triggers, though, and your stops, are entirely within you. They are your choice. Those choices may be made according to what's on the chart, but whatever connections there may be are in your head. The market, in other words, couldn't care less what you're comfortable with. If you can't find an S/R level that provides you with a trigger that's tight enough for you with a stop that's tight enough for you, then leave that particular level alone.

As for the adjustments, your lines should be consistent from left to right. You have what appears to be an important line on your first chart at 5625, but this then disappears. The adjustment I made was to 5612.5, which is echoed in the line you drew on your second chart at 5615, which seems to come out of nowhere, but is based -- or should be -- on the S/R line drawn on the first chart. As for the line drawn at 5675 on the second chart, this is drawn by you on the first one, but left off the second one, and extending that line underneath that first swing low to 5675 strengthens the potential importance of the line. 5675 is also left off your third chart, even though, again, you drew it on your first.

Db
 
db, early recognition of apex bar as it closes .......is that worth pursuing? thanks
 
apology

firewalker,

Please excuse the db question from me.......i didn't mean to be rude interruptor ...just a stop loss setting remark triggered by the death by a thousand cuts response..too close to home for me...I believe stop settings are very critical to trading success.... ..the loose stop/trailing stop being set just to "get out of the way" is just as dangerous as the tight stop or the mental stop for any but the few...i am not one of the few...all remarks IMHO.. best wishes .ymonly
 
Status
Not open for further replies.
Top