Hi everyone
Am newer to using Fibs and have just discovered this thread.
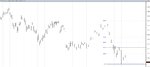
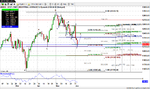
Have I marked up these charts for the DJIA and S&P 500 correctly? So we are indeed seeing the beginnings of a bounce from the zero line?
Hi,
This is how I analysed INDU:
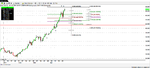
1 - Attached is the daily chart of $INDU
2 - I've labeled ABCD and 123 etc. Please note this is for reference and not an attempt on the Elliot wave count so should not be confused with it.
3 - Notice C marks the 38.2% retracement of the AB.
4 - Friday's close also found support at the level and closed above it.
5 - Also note that 4 also marks the 100% Alternate price projection of the move CD (or a 100% retracement of the move).
6 - The current trend has been downward with short lived rallies.
7 - Interesting thing to note about these rallies is that they have similar amplitude or symmetry 1=1.
8 - When the amplitue of the moves is taken and then projected from 6 downward, the 1.618% projection comes around the 12150 area, the market closed above these levels (slightly so)
9 - Given these Fibo ratios we have a good confluence level for support or a bounce back. The bounce back is likely to be terminated at 38.2% of AD or a stronger resistance comes around 12400 area.
10 - The market may break down to the 61.8% retracement level of AD on the intraday level basis. A close up could mark a rebound which could be short lived.
Also notice the momentum is flatenning. For the bounces seen the momentum has given good clues. I use the momentum indicator as price precedes momentum (from experience).
I hope you will find this helpful.