I seem to have come up with something that suggests that everyone is looking at Fibonacci the wrong way. What I do is consistent across timeframes, currency pairs and history - and it's all based on Fibonacci. If you are interested, read on....
Take a step back from your trading for a minute. How long have you been looking for answers, the perfect technique, the best system, the best mentor? When you first started trading, you probably thought it would be a good way to make money, to free up spare time for other things and to generate wealth while you slept. Is that what happened? If not, do you know why, or are you still looking for the special technique that’s going to make it all come true?
Most traders face this dilemma at some point—for good reason. We are all driven by our subconscious programming, and much of it is negative. At an early age, we take on certain beliefs about ourselves and about the way the world works, and these beliefs have a huge impact on how we live our lives. We come to certain subconscious conclusions about how worthy or deserving we are and we literally create circumstances that confirm these negative beliefs. Because this dynamic is largely subconscious, we don’t realize it’s happening, nor do we realize the impact it has on our ability to generate wealth, success or happiness. We may spend time researching techniques, reading books, saying positive affirmations and posting checklists on our monitors but, ironically, this can make matters worse, increasing the internal conflict between our subconscious programming and the way we know things really should be. And because we are unable to step outside ourselves to see what is really going on, we end up going around in circles, losing money, getting increasingly frustrated and gradually losing faith in our ability to ever create the kind of life we envisioned.
Triggering many of these issues is the fundamental problem of accurately determining where the currencies are going and how far they will move. The world of Forex is full of theories, techniques, ideas and systems, with everyone looking for a sure-fire, consistent way of getting it right. But no matter how good a system might be, and no matter how many other traders might be having success with a particular system, you cannot win at trading simply by doing what others are doing. If you do not address your particular subconscious issues, you will end up sabotaging your efforts at every turn.
Finding a good trading technique AND resolving your internal issues requires an understanding of underlying forces and patterns. There is an inherent rhythm to currency movement, just as there are certain patterns within us that keep repeating. I realized this essential truth when I discovered the Absolute Fibonacci framework—a revolutionary new way of trading that remains consistently valid, no matter how long you use it.
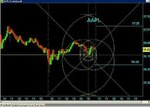
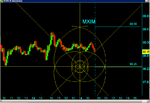
We know that the candlesticks move to patterns, so the patterns must exist before the candlesticks reach the points they reach. It therefore makes more sense to search for the pattern on the charts, rather than in the resulting currency movements. And this is what the Absolute Fibonacci Framework© shows. It is a framework that can be applied to charts permanently, revealing the fractal patterns by which all currencies move. It can be used in conjunction with any trading system and does not require special software. Those who use the framework discover that any successful systems that they have been using yield information that is consistent with, and confirmed by, the framework. That isn’t surprising, since most systems are striving to interpret the movement of candlesticks, rather than understanding that their destinations are pre-determined by an inherent pattern, which is conveyed by the framework. Elliott waves, for instance, are simply waves that form as a result of currencies meeting points of resistance on the framework, as can be seem in this example of the recent moves on the USD/CHF pair.
The Absolute Fibonacci Framework is completely consistent on any timeframe and any currency pair, and it offers advantages to novice and experienced traders alike. Novice traders can grow with their experience and stay reasonably within their comfort zone. Experienced traders can use the framework to plan position trades. Intermediate traders can establish the likely travel of, for instance, the GBP/USD on a Non Farm Payroll move – to the pip! :idea: