Eur-Usd SL demo trades

Hi Folks,
No trades for me yesterday; I was on the road all day.
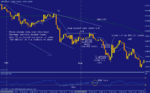
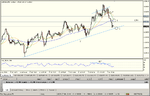
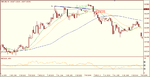
Came back to take a look at the Eur/Usd this morning and saw a possible set up developing.
I took two trades both of which went pear shaped but for different reasons.

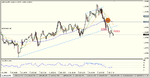
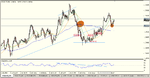
The first trade was a short off a nice looking NDT with a T/L break. I was a bit nervous though because S/R 1 had not been broken; I was taking a chance that price would break out below it with some momentum and deliver decent pips.

I think it was because of my nerves that I decided to close out the trade as soon as the
move hinted at going against me. -50 pipettes was the resultant loss.

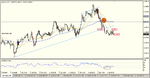
Next I noticed a possible long based on a PDB with an inside bar break. i conveniently ignored the fact that price was just below S/R 1 and RSI had not actually gone oversold.
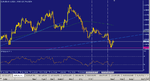
As the move progressed I also turned a blind eye to the awful looking price action which followed. I fell victim to a gap down against my position, just the sort of move I was looking for in my first trade!
Consequently I failed get out within my loss budget and took a -116 pipette hit.

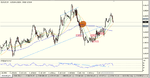
There were some nice long entries available (circled) a little later but I needed to step back for a while.

Best Regards,
Neil
 

Attachments

  • eur-usd-thur-19-mar-09.bmp
    1.4 MB · Views: 106
Following on from my last post, I returned for another look a little later and saw a nice
triangle type set up developing.
I went short as S/R 1 was broken but the move faded out leaving me with just 73 pipettes on half the position and virtually zero on the second half as my BE stop was hit.

My fourth trade was better. NDT failure entry with trend line T1 / triangle break out.
I took early pips on the first half and trailed the stop up behind the SMA(23) on the second half.

I quit for the day after that; it's very rarely that I capture anything like that twice in a day and I usually just finish up making losses on subsequent trades.
Now days I think leaving oneself gaps for recovery is important; it gives you a chance to consolidate and take stock.

Best Regards,
Neil
 

Attachments

  • eur-usd-thur-19-mar-09a.bmp
    1.4 MB · Views: 106
Hi Folks,

I've sort of strayed into unknown territory here.
Monday started in a fairly ordinary way, watching the Eur-Usd 1min chart.
I watched the break out occurr at 12:26 followed by re-trace.

I made a mistake, went long just at the height of the second peak following
the break out. Fortunately I had my stop in pace at the re-trace low.

As the trend line was broken, I went short 0.4 lots. After a slight move north
the price fell away and I was able to close 0.2 lots and move my stop to B.E.
+193 pipettes.

I trailed my stop down until the SMA(23) was touched and closed 0.1 lots for
+573 pipettes.

Now the next bit is where I did something different.

I'm left with a 0.1 lot open position, short. I decide to let it run but move
my stop up to 1.36851, way above the recent high. I figure I'm just risking the
pips I've already made.

So moving the stop wider was my first sin.

Now for the second one...
I switched to the hourly time frame.

I am currently just letting the position sit there to see what happens.
Either I'm stopped out or I make more pips. I have no idea what my exit
criteria are.
At time of writing there are +1249 pipettes profit on the table.

Best Regards,
Neil
 

Attachments

  • eur-usd-mon-23-mar-09.bmp
    1.4 MB · Views: 100
  • eur-usd-mon-23-mar-09hour.bmp
    1.4 MB · Views: 105
Hi Folks,

I've sort of strayed into unknown territory here.
Monday started in a fairly ordinary way, watching the Eur-Usd 1min chart.
I watched the break out occurr at 12:26 followed by re-trace.

I made a mistake, went long just at the height of the second peak following
the break out. Fortunately I had my stop in pace at the re-trace low.

As the trend line was broken, I went short 0.4 lots. After a slight move north
the price fell away and I was able to close 0.2 lots and move my stop to B.E.
+193 pipettes.

I trailed my stop down until the SMA(23) was touched and closed 0.1 lots for
+573 pipettes.

Now the next bit is where I did something different.

I'm left with a 0.1 lot open position, short. I decide to let it run but move
my stop up to 1.36851, way above the recent high. I figure I'm just risking the
pips I've already made.

So moving the stop wider was my first sin.

Now for the second one...
I switched to the hourly time frame.

I am currently just letting the position sit there to see what happens.
Either I'm stopped out or I make more pips. I have no idea what my exit
criteria are.
At time of writing there are +1249 pipettes profit on the table.

Best Regards,
Neil

Hi Folks,
Finished up out for BE on the trade in my last post.

Here's an interesting one from today on Eur-Usd.
I took a hit for -97 pipettes initially but made good on the subsequent trade.
I was supposed to close out the positions on the winning trades using SMA(23) but
I left 0.1 lot to run on and closed it when I had built up enough fear of loss, not recommended.

Still it's taken a long time but I've sort of learned one thing; it's worth taking into account the trend direction on the hourly time frame whilst trading the 1 minute chart.
 

Attachments

  • eur-usd-thur-2-apr-09.bmp
    1.2 MB · Views: 103
There are times when these RSI fails work out very nicely....
 

Attachments

  • eur-usd-tue-7-apr-09.bmp
    1.3 MB · Views: 110
Hi All,
A couple of charts from today.
They make a 'before and after' type pair.
This is the only trade I took today; I'm reducing the number of trades made but documenting them in more detail.
I've got most of the elements of an actual system in place now but I'm still struggling with a couple of things such as initial stop positioning and determination of exact entry point. There is still a degree of discretion at play with these.

Best Regards,
Neil
 

Attachments

  • eur-usd-wed-8-apr-09.bmp
    1.1 MB · Views: 112
  • eur-usd-wed-8-apr-09b.bmp
    1.2 MB · Views: 104
Hi Folks,
Here's today's trade.
It was on Gbp-Usd. Price was heading down over the first hour and was under the SMA(120)
so I was only interested in looking for short set-ups.

The RSI went oversold and formed a nice PDB. The failure of this divergence provided the short entry signal circled on the chart. I closed half the position when the price stalled a little and used the SMA(12) to close the other half. I was a bit slow on the exit on the second half and lost most of the pipettes.

Problem I have with these trades is that the initial stops feel a bit too wide at 134 pipettes with the gains being 1/2 at 294 and 1/2 at 87.

Best Regards,
Neil
 

Attachments

  • gbp-usd-thur-9-apr-09.png
    gbp-usd-thur-9-apr-09.png
    22.3 KB · Views: 119
hi bansir.

have you stopped trading this method?

Hi Trendie,
I'm still trading RSI divergences on 1 min Fx Gbp/Usd and Eur/Usd
I'm finding that it's hard to purley verify the system because I have aquired many ways of determiing when to enter a trade and these come into play maybe on a subconcious level even when I don't want them to.

I have had another good month but hesitate to go live due to termoil in other parts of my life.
Nice to hear from you; thanks for dropping in.

Very Best regards,
Neil

Best Regards,
Neil
 
Record keeping

Hi Folks,
Haven't posted for a while.
I did have a good month in May as far as demo trading was concerned. June was okay for the most part but then I lost all discipline in the last few days of the month.

Looking back, my record keeping has steadily degenerated into a pretty poor state and now is really nothing more than scirbbled notes. The goal for July is to address this problem and actually produce a respectable and useful trading log.

Here are my two trades from today on Eur-Usd.
There are quite a few charts; I took snapshots as the trade progressed.
A quick look at the Hourly candle chart (eur-usd-6-jul-09) this morning revealed that price was trading under the 8am level and moving south so I was looking for short entries on the 1min candles.

On chart eur-usd-6-jul-09a I notice a few iteresting feaures:
1. The NDT
2. The fasy SMA cross at 'A'
3. The potential SMA cross at 'B'
4. The S/R break

I was looking to short on a breach of T1 at 'C'

Chart b
The entry gets triggered at 'A' an I'm short at 1.39091 , 0.5 lots
My mental stop is behind the green SMA(12)

Chart c
I'm trailing the stop, the trade looked promising.

Chart d
Price stalls, finds support.
I don't like the way the RSI has plunged into oversold at 'A'

Chart e
The move resumes but RSI is still looking oversold.
I move my mental stop down behind the SMA(12)
I'm past BE point

Chart f
Essentially, I lose my head at this point.
The price whips back and I am slow to close but still get out just on BE.
Unfortunately I allow myself another shot at the short, a sort of 'lets not miss
out on the move' emotion takes over.
I go short again at 1.39032, o.5 lots.

Chart f
Price whips back up again but this time I HAVE NO PLAN and I don't know
where to get out. I close on pure fear at 1.39108 (-76). Ouch.

Chart h
Just for interest this one, notice how the price respects the earlier S/R level and indeed
forms a pivot type bounce later on.

Well there you go...
One break even and one cheap rap on the knuckles for entering on impulse.

Best Regards,
Neil
 

Attachments

  • eur-usd-6-jul-09d.png
    eur-usd-6-jul-09d.png
    18.5 KB · Views: 136
  • eur-usd-6-jul-09c.png
    eur-usd-6-jul-09c.png
    18.3 KB · Views: 132
  • eur-usd-6-jul-09b.png
    eur-usd-6-jul-09b.png
    18.3 KB · Views: 112
  • eur-usd-6-jul-09a.png
    eur-usd-6-jul-09a.png
    23.1 KB · Views: 113
  • eur-usd-6-jul-09.png
    eur-usd-6-jul-09.png
    17.3 KB · Views: 108
  • eur-usd-6-jul-09e.png
    eur-usd-6-jul-09e.png
    18.3 KB · Views: 122
  • eur-usd-6-jul-09f.png
    eur-usd-6-jul-09f.png
    18.5 KB · Views: 132
  • eur-usd-6-jul-09g.png
    eur-usd-6-jul-09g.png
    20.5 KB · Views: 147
  • eur-usd-6-jul-09h.png
    eur-usd-6-jul-09h.png
    20.5 KB · Views: 127
Last edited:
trade 1

Hi Folks,
Two trades today, here's the first one:

chart 7-jul-09
----------------
Looking for longs today on eur-usd due to up trend on hourly candles which moved
above the open.

07-jul-09a
NDT forms and then fails.
Take long entry at 1.40160, trailing stop just below SMA(23).

07-jul-09b
Price retraces, forms new NDT things don't look too promising.
Follow the plan and trail mental stop up behind SMA(23) to BE.

07-jul-09c
Close out manually after SMA(23) is hit.
Finish up with 1.9 pips, scratch trade.
 

Attachments

  • eur-usd-7-jul-09.gif
    eur-usd-7-jul-09.gif
    17.5 KB · Views: 118
  • eur-usd-7-jul-09c.gif
    eur-usd-7-jul-09c.gif
    16.4 KB · Views: 115
  • eur-usd-7-jul-09b.gif
    eur-usd-7-jul-09b.gif
    15.8 KB · Views: 121
  • eur-usd-7-jul-09a.gif
    eur-usd-7-jul-09a.gif
    15.4 KB · Views: 116
2nd Trade

Hi, here's my second eur-usd trade today.

chart 7-jul-09d
Again, looking for a long entry at the NDT failure.
Get in at 1.40270

chart 7-jul-09e
The price moved off fairly quickly and I trailed the stop
up behind the SMA(23).

chart 7-jul-09f
Stop trailed above BE

chart 7-jul-09g
stopped out at 1.40373
Just 10.3 pips profit.

Not much but stress free.

Best Regards,
Neil
 

Attachments

  • eur-usd-7-jul-09d.gif
    eur-usd-7-jul-09d.gif
    15.7 KB · Views: 132
  • eur-usd-7-jul-09e.gif
    eur-usd-7-jul-09e.gif
    15.5 KB · Views: 137
  • eur-usd-7-jul-09f.gif
    eur-usd-7-jul-09f.gif
    16.1 KB · Views: 119
  • eur-usd-7-jul-09g.gif
    eur-usd-7-jul-09g.gif
    15.9 KB · Views: 103
Trade 1

8-jul-09
08:52 short

Took a fairly early Eur-Usd trade today.
At the time, price was below the open and the hourly candles were down
so I was looking for shorts.

A nice little congestion region formed as the fast SMA(12)+SMA(23)'s crossed.
I took the short entry at 1.38874 as support broke down just under the congestion.

RSI was nicely poised at around 40 'ish.

I used the orange SMA(23) as a mental trailing stop.

I was into profit quickly and had chance to slide the stop down.

The sharp retrace a couple of minutes later, took my stop out at
1.38919

A loss of 4.3 pips
 

Attachments

  • 8-jul-09b.gif
    8-jul-09b.gif
    18.8 KB · Views: 123
  • 8-jul-09a.gif
    8-jul-09a.gif
    19.4 KB · Views: 138
  • 8-jul-09.gif
    8-jul-09.gif
    14.9 KB · Views: 112
trade 2

Trade 2 from today.

Chart 8-jul-9d
This shows another possible Eur-Usd setup developing.
We have a negative divergent top and the fast SMA's have crossed.

Price has re-tested the 8am level.

If the 8am level is broken I could look to go short.

Chart 8-Jul-09e
The SMA's have crossed and price has fallen below th 8am level of
1.39160.
I'm looking for some sort of pull back to enter a short trade.

The idea would be to slide the stop behind the SMA(12) and use the
lower trendline as an exit target.

Chart 8-jul-09f
I go short 0.5 lots at 1.39072 as the recent low is broken.
The mental stop is set behind the SMA(23).

Chart 8-jul-09g
The price whips back and I close at 1.39150, 2.3 pips above my stop.

That's a 10 pip loss on this trade.

Afterwards, I notice the positive divergence on RSI.

This evening, with hind sight there appear to be several conflicting
features within the charts.
You really need all signals to be in harmony to catch a trend.

Best Regards,
Neil
 

Attachments

  • 8-jul-09g.gif
    8-jul-09g.gif
    19.5 KB · Views: 138
  • 8-jul-09f.gif
    8-jul-09f.gif
    20 KB · Views: 116
  • 8-jul-09e.gif
    8-jul-09e.gif
    19.8 KB · Views: 128
  • 8-jul-09d.gif
    8-jul-09d.gif
    19.4 KB · Views: 122
Trade 2 from today.

Chart 8-jul-9d
This shows another possible Eur-Usd setup developing.
We have a negative divergent top and the fast SMA's have crossed.

Price has re-tested the 8am level.

If the 8am level is broken I could look to go short.

Chart 8-Jul-09e
The SMA's have crossed and price has fallen below th 8am level of
1.39160.
I'm looking for some sort of pull back to enter a short trade.

The idea would be to slide the stop behind the SMA(12) and use the
lower trendline as an exit target.

Chart 8-jul-09f
I go short 0.5 lots at 1.39072 as the recent low is broken.
The mental stop is set behind the SMA(23).

Chart 8-jul-09g
The price whips back and I close at 1.39150, 2.3 pips above my stop.

That's a 10 pip loss on this trade.

Afterwards, I notice the positive divergence on RSI.

This evening, with hind sight there appear to be several conflicting
features within the charts.
You really need all signals to be in harmony to catch a trend.

Best Regards,
Neil

Neil

Good posts. But take all those lines off the chart and you will see what the market is actually doing. Only my opinion - i used ma's, rsi etc now just look at at the chart and surprise surprise with no indicators its easier.

Regards
 
Neil

Good posts. But take all those lines off the chart and you will see what the market is actually doing. Only my opinion - i used ma's, rsi etc now just look at at the chart and surprise surprise with no indicators its easier.

Regards

Hi Claudia,
Thanks for dropping by..
I do like to use the price action too. I'm just running with a system that has evolved over a couple of years so I don't want to make any sudden changes.

Could I just ask in your system, how do you exit trades based on price action?
Do you trail stops below recent lows for example?
Best Regards,
Neil

Hi

My main system is very basic. Look for a break out from the Asian session starting at 7.00 am - if no break out by 10.00 am no trade. Only trade GBP/USD on this with 50 tic target and 35 tic stop. Works well in current market and no need for lines!!! Could be automated if I was clever enough!
 
gbp-usd trade

Hi Folks,
Some more trade snapshots...

9-jul-09
gbp-usd trade, 1 min charts.

First pic. shows strong move up from uk session start on hourly candles
so I'm looking to go long only.

The second chart shows my entry following a failure of the NDT.
Long 0.5 lots at 1.61880

An entry on the break out from T1 would have been nice but I wasn't
at the PC at the time.

Third chart shows trailing stop for exit.

Fourth chart, I put a stop loss order in place,looks like I'm out.

Fith chart, stop is hit. Exit trade at 1.61968 for +8.8 pips.

Best Regards,
Neil
 

Attachments

  • 9-jul-09 hourly trend.gif
    9-jul-09 hourly trend.gif
    14.1 KB · Views: 130
  • 9-jul-09-gbp-usd-1.gif
    9-jul-09-gbp-usd-1.gif
    17.2 KB · Views: 112
  • 9-jul-09-gbp-usd-2.gif
    9-jul-09-gbp-usd-2.gif
    16.5 KB · Views: 115
  • 9-jul-09-gbp-usd-3.gif
    9-jul-09-gbp-usd-3.gif
    15.5 KB · Views: 118
  • 9-jul-09-gbp-usd-4.gif
    9-jul-09-gbp-usd-4.gif
    17.3 KB · Views: 112
  • 9-jul-09-gbp-usd-5.gif
    9-jul-09-gbp-usd-5.gif
    17.6 KB · Views: 123
break out trade

I took this break out trade just after the trade on the previous post.
It didn't work out, never mind. (-7.9 pips).

I stopped myself out as price hit the SMA(23) but my original plan
was to get out at the SMA(12). I must remember to follow the plan.

Best Regards,
Neil
 

Attachments

  • 9-jul-09-gbp-usd-1min-2a.PNG
    9-jul-09-gbp-usd-1min-2a.PNG
    26.2 KB · Views: 119
Top