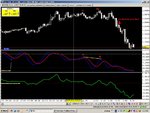
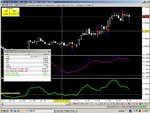
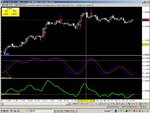
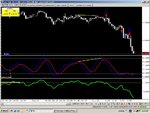
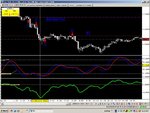
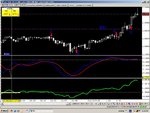
Here is a scalping method I have been playing with, having some success. It certainly isn't perfect, but it is a start. Looking for constructive comments to refine the method and hopefully make it consistent and profitable.
The set up being a 10 min EUR/USD chart. I use CMS and the VT platform, but I trade live with Oanda to reduce the spread (0.9pt).
Attached I have a Stochastic (Slow) set at 10,6, 6 with horizontal lines at 80 and 20. Then I have a MACD set at 4, 12, 1 with a zero horizontal line. With the MACD, I background colour the histogram so I can't see it on my chart. So what you should end up with, is a indicator that looks similar to a RSI (one line snaking around the horizontal line)
Now I mainly trade during the UK session and part of the US session. Obviously there is more action during these times.
I have been looking for a cross on the Stoch and taking the entry on the open of the new candle once the cross has been confirmed. It seems to work better when the Stoch is either up over (or near) the 80 line or down below (or near) the 20 line. However it does work with just about any cross. I will also look for the MACD line to be at least pointing in the same direction on entry ie going long, I want MACD pointing up and vice versa for a short. It would be preferable to have the MACD pointing both up and above the horizontal line to long, but this isn't really necessary.
The cross of the Stoch is the main indicator, and MACD is used for confirmation.
Tight stops and monitoring are required. Look for Stoch to cross back for exit, or even MACD change direction. Normally you can just eyeball the chart, and you should get an idea of the big picture, so probably best to keep a very close eye on trades against what appears to the main trend.
Also watch out for major news. Time to be out altogether if scalping. Consider trailing a stop, maybe closing out 1/2 at a certain level and then moving remaining half stop to B/E.
As stated, a work in progress, so feel free to experiment and submit ideas or comments. Cheers.


