rtsurvivor
Member
- Messages
- 53
- Likes
- 2
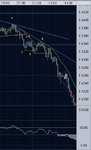
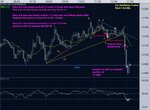
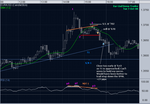
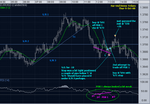
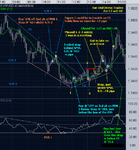
Hi neil. I looked at the same trade this morning. This is how I seen it.

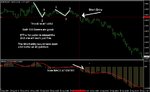
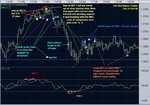
I'm trying out a couple of new indicators i came across. For the most part they are ok. But, they are still in the testing stage. You have to use a bit of judgement and indicators that support the up/down arrows. 👍
Two questions.
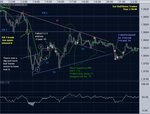
A NOTE: I've also got a new EA that I'm trying. It does the trading for me. I'll post the forward results as I go this coming month.
Good trading
RT... :idea:
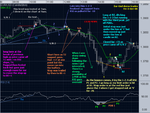
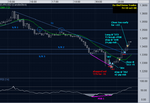
I'm trying out a couple of new indicators i came across. For the most part they are ok. But, they are still in the testing stage. You have to use a bit of judgement and indicators that support the up/down arrows. 👍
Two questions.
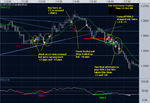
- Did you spot the 123 Down pattern just before the break down this morning? There's a grn arrow - yellow arrow - grn arrow at the 3 points of the pattern. The yellow arrow is pointing at the #2 point.
- How do you get the thumbnail pics to work? I'd much rather post the thumbnails. :cheesy:
A NOTE: I've also got a new EA that I'm trying. It does the trading for me. I'll post the forward results as I go this coming month.
Good trading
RT... :idea: