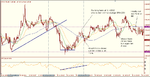
EUR-GBP
Tue 14-Jul-09
Here's a flawed trade, but maybe it throws some light on certain aspects
worth consideration.
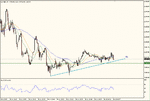
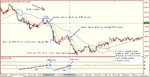
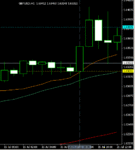
chart a
-------
I was looking to play the breakout from T1.
The hourly trend was down so I was waiting for an opportunity to
go short.
A potential setup apppeared as T1 developed; I could consider a
short entry if price broke below the T1 line.
However, a few things weren't quite right .
1. First there was no negative divergence of RSI against price.
2. RSI was not overbought, >70 at any stage. In fact it was
meandering along around mid-range.
3.The timing.... US session was about to start.
I was so fixed on making the trade, I refused to acknowledge
any of these facts.
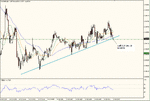
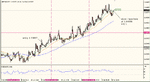
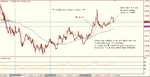
Chart b
-------
I jumped into the trade at 13:28, short 0.5 lots at 0.85730
I was quickly into profit with my stop above the fast SMA's
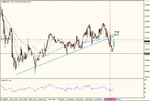
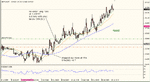
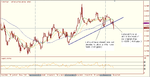
Chart c
-------
US session starts and I'm stopped out at 0.85743
-1.3 pips so not the end of the world.
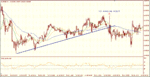
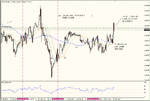
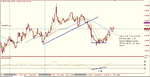
Chart d
-------
Sideways price move continues after things settle down again.
Notes..
Be aware of session period starts.
Don't become too fixated on making the trade, acknowledge what the
conditions are. Maintain awareness.
Best Regards,
Neil