Dow Intraday charts 28/07 - 01/08

ChartMan

Legendary member
Messages
5,580
Likes
47
Not a good day today. I missed the ND and went long 999.5 and took a 3 point hit.:( I managed to get back 2.5 later and called it a day. With the narrow range of 65 points or so, there was little chance of some decent action. Is that a woolfie I can see across the low at 9240?
2 sneaky PD's and an ND thrown in for good meaasure- not that they would have clocked you many points...... A scalper's day.
 

Attachments

  • dow 28-07-03 1 mina.gif
    dow 28-07-03 1 mina.gif
    24.5 KB · Views: 659
OK the bigger picture is required.I thought 9300 may get a re-test tonight..... Instead we've tested support. ES moved up 3 points convincingly after the close....
So, it's 9200 and bust or 9270 and fly....maybe.9240 will have to go first though.
 

Attachments

  • dow 29-07-03 10 mina.gif
    dow 29-07-03 10 mina.gif
    30.4 KB · Views: 605
Good day for those that got hooked in with the early short- he who dares wins? Good call by Bullish Bear in the chat room....Easy bottom call with the PD and "W" for the long. Big problem today was the exit from the long. No clear exit unless I'm missing something? OK there was ND across 17:00 to 18:30 but hard to see and harder to call... The hard exit was the 100 MA break at 19:08 , but taht was 30 + off the top. No clear cut targets anywhere, but a few guidelines to call off. All in all an easy day on the face of it, but not easy in practice.
 

Attachments

  • dow 29-07-03 1 mina.gif
    dow 29-07-03 1 mina.gif
    24.6 KB · Views: 613
I wish I could say with some certainty where this is going, but I can't. One half says the last triangle has broken to the downside, the other say this will now break to the upside. Either way , there is a 150 point move coming up. SO that makes 9350 or 9050. I do like the pre-emptive breakout on RSI...
Frankly, I don't give a dam... :)
 

Attachments

  • dow 30-07-03 10 mina.gif
    dow 30-07-03 10 mina.gif
    26.3 KB · Views: 585
What an aweful day. I took a few points on ES and that was it.... It was the sort of day where I can imagine peeps getting whipsawed to bits , Biggest move of the day was only 60 points. With bias and indecision, that would have ended up as 20 points max.... The only chance of a half reasonable trade was coming off the ND top and gambling, but we don't do that do we? I can't make head nor tale of anything here. The concensus of opinion is a big move tomorrow..... We need it to cover today's lossses. My 3 points on ES actually looks like a good result.
 

Attachments

  • dow 30-07-03 1 mina.gif
    dow 30-07-03 1 mina.gif
    24.5 KB · Views: 588
yup, absolutely horrible day - just my luck - first day I've had in weeks where I've been free(ish) to trade with real money and look at it ...... just as well I reduced my stake to a 1/10 of usual 'cos I had a feeling it was gonna be like this :)
 
Congratulations Mombasa. I wish a few more would do that. They'd stay in the game much longer! Today was a different thing. My target prediction from yesterday was a bit off- I reckoned 9350 and we made 9360. :)
Good points on the table, if you waited for the open to settle down and clock the triangle with 80 points on the table . The trap was the break in the middle of the triangle- no way out of that and probably a double whipsaw for the unwary. Taking the right side of the 100MA would have meant a potential large fall back if you stayed in. Almost impossible and very stupid. There's no easy solution to that one, except looking at ES volume to figure it out. So taking the triangle break made 80+ with another 20 taking the 3rd peak ND out.
Staying out and waiting was the real reward. There was NO short entry till the third top at 9360. That was confirmed by the flat 3 peaks on RSI at 60 against a rising price- that's still ND. So a short entry was perfectly safe at 9350, with a stop at 9360. NOT the SB price, the CHART PRICE!!! Had the chart price touched 9360 again, the SB price would likely have been 9370+- ignore that. A perfect pullback to the 100 MA gave a target at T2 for another 80 points, then riding your luck right into the close for another 20 making a big 200 points for the day. No doubt a few more for the scalpers from the open.Trading ES from the pre-open would have added another 80 dow points ( 9 ES points).
That's a lot of easy points in one day...... Should have paid for any nasties you got caught in yesterday. :)
 

Attachments

  • dow 31-07-03 1 mina.gif
    dow 31-07-03 1 mina.gif
    20 KB · Views: 513
Chartman, I have to say I wouldnt have seen that triangle (still not sure that I do, to be honest), but I did go long on the break from this little sweetie, which to my eye gave a perfect pullback confirmation, but a small-ish target which turned out to be a monster move ;)
 

Attachments

  • asctri.jpg
    asctri.jpg
    29.2 KB · Views: 478
It just goes to show you rosso that we all trade the same market and see a slightly different triangle forming but all enter around he same time.

Regards mark
 

Attachments

  • dow.jpg
    dow.jpg
    52.8 KB · Views: 460
hi chartman
sorry for my ignorance. what is pd/nd stand for.
and what is the good charting package to use.
my end of the day data from sharescope does'nt give much to day trade.

thankyou
 
sumathik,

It should all be explained here:-

http://www.trade2win.co.uk/boards/showthread.php?s=&threadid=5785

and a bit about charting software

http://www.trade2win.co.uk/boards/showthread.php?s=&threadid=5823

Or to start with, this free page might help. Just click on $INDU, select 1min and at the bottom select 100ema and off 4. I find that works best.

http://fast.quote.com/fq/cts/livechart.html?symbols=&wd=900&ht=500

I use Quotetracker. It is free, with advertising, but the website has been down for the past 24 hours. I use Stockwatch for the data. I think it is $15.95 a month.

http://www.quotetracker.com/
 
Last edited:
I did it slightly differently - waited for the open to settle down, thought abot going long just before the spike up - waited too long and missed it - didn't spot the triangle forming but went long on the bounce off the 100MA after the drop from the spike up. Got out on the 3rd ND peak and then stayed out - wasn't around for the drop at the end.

Question : was my entry safe or did I just get lucky?
 
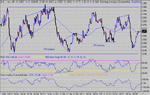
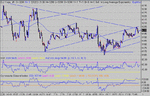
I have to say this, there is always an element of luck plus an element of skill od judgement. Remember that I analyse these charts AFTER the event and so some things look like magic or clever. It's neither of these. Sometimes you see things differently, as shown above, sometimes you don't see them at all, including myself, until after the event, at which point it becomes so obvious you just wonder what you were doing!
No one knows what the next tick will produce or what the next triangle b/o will produce. More often than not, a good setup will produce the expected result, sometimes not. That's why we need stops. Calling these moves in real time, with the stress and expectation of a profit is totally demanding and will often lead to mistakes and "misses" or wrong calls. I am perhaps a little more fortunate than some, in as much as I do not trade for a living, nor do I HAVE to make a profit. Therefor my trading approach is more relaxed than the average trader and I find that my concentration level is higher because of that. I envy any trader that is able to deliver consistent profits, whatever they trade. I thought I caught a nice b/o today at 979.5, but it bumbled around for an hour and I closed for a measly two points. Yesterday it was a 100 ( 9 points on ES). Not going to be any big moves today so I'm just watching without any expectation.
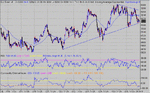
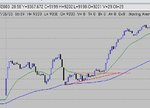
So Mombasa, your entry was skilled, lucky and safe. :)
The risk was 20 points below the 100 MA, the reward was 80 points so 4:1 most excellent. As it was, your theoretical ratio was almost 6:1.
 
Yuk, another poo day... Whipsaws delight. The triangle held some promise but failed to deliver. I guess there will be some peeps that gave back their Yesterday's winings today.It's a tough call staying out of the market. I've said it before, having no position IS a position. Hard, I know, been there done that. IF you must, play with 1/10 stake and treat it as a proper gamble...... 9399 was a bit optimistic wasn't it? :)
 

Attachments

  • dow 1-08-03 1 mina.gif
    dow 1-08-03 1 mina.gif
    20.8 KB · Views: 409
Hi Chartman,
OK, this coment has got me puzzled...

There's no easy solution to that one, except looking at ES volume to figure it out.

It refers to the early false breakout on the 31st July.
Here's the ES mini futures volume.
There's a huge surge in vol at point 1, right on the false breakout.
The vol increases at 'a' to 'e' are lesser events so what were the warning signs in the volume?
I guess I'm asking how one reads the volume clues. :confused:

Many thanks CM
Cheers for now,
Neil
(hope my chart comes out ok)
 
Hi Bansir, that volume spike(1) at 14:59 was data related,(Chicago PMI ) the others display more classical Vol characteristics with TA formations.

Chartman & Skim will probably explain it much better than I ;)

Cheers a320
 
Last edited:
In a nutshell, the vol will tell you when the buyers or sellers are drying up. The smartest use is at PD bottoms. There is often a clear divergence in the sellers volume versus the price. i.e. the price makes lower lows, but the seller volume peak is lower than the previous one.I know that on simple charts you have to use a bit of poetic licence as the buy/sel colour is purely related to the curent tick. If the current bid /offer is lower than the opening tick price, then ALL trades are taken as sells.If the current bid/offer is higher than the open then all trades wil be shown as buys. You need a smart software package that shows you "time and sales" if you want to see the truth of the buy and sell volume within a tick.
The micky mouse approach works well enough when used as a second confirmation, such as a bottom call......
Over to Skim, our resident volume expert :)
 
Thanks a320/CM,
I'll try using the volume indicator, looks like it could be useful as you say, for confirmation although I do find it difficult to interpret.
Do we get many false 'data' glitches on volume? How do you spot them?
With hind sight, the two spinning top candles (15:31/15:32)following the small pull back perhaps gave us a hint of the possibility of a larger move.
Sorry about the chart size, I'll go and re-read 'how to post a chart'
now :))
Friday wasn't too clever for me either. Made -24 points paper trading but using proper biased sb prices.

Thanks again folks.
Neil
 
I don't think you get "false" volume spikes as such. They are all real, and tell a story, whether it be a reaction to a news event or normal trading activities. Unlike EOD data that is predominently "compiled" and therefor can contain errors.
 
Top