Dow Intraday charts 26/Jan - 30/Jan

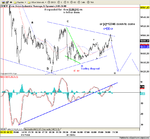
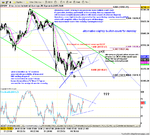
OES - It's always difficult trading when it's in sideways/consolidation mode - making a big triangle over two days showing on the 10/60min charts - ready for a big break on Monday, direction dictated by the ISM data imho......

I had three decent trades, basically entering and exiting on PD/ND which works well in a sideways market - I think that CM deserves a medal for devising the trading system......

now for a shandy or two.... :cheesy:
 
Not a lot on today, but patience would have been rewarded tracking the progress from the H&S that failed, finally developing into a triangle break at 450. The short entry for the H&S delivering would have been at 440 @16:17 ish. So a long on the triangle break, but with a tiny target of only10 points...Support held at 452 and a slope change followed.. always encouraging, and led to the ND top for an out for 30 odd. The following mini bear flag stopped right at target,giving no profit for taking a short...but the divergence offered another long entry and a bumpy ride up to 500.
Closing at HOD could see a move up on Monday.....Plenty of buyers on ES at the close.
 

Attachments

  • dow 30-01-04 1.gif
    dow 30-01-04 1.gif
    29.6 KB · Views: 345
wellshot
do you see what I see ?

how about an abc 2 wave from 10440 to 10505 ?

lol
 
While the markets hesitate and deliberate over Sir G's change of tone from "considerable period " to "patient"......

'Woody Allen' Greenspam has a clearer message to which Wall Street will relate instantly:-

"money is important if only for financial reasons"

could be a rally on Monday......... ;)
 

Attachments

  • woody.jpg
    woody.jpg
    3.3 KB · Views: 403
last post

think i've probably over posted on my first couple of days!!
 

Attachments

  • snapshot-25.png
    snapshot-25.png
    37.4 KB · Views: 413
my last post

this is my last post on this board --i'm finding it exhausting
the chart given follows on from earlier and otherwise compliments the one above as the alternative to the triangle which i have serious misgivings about [esp' for targets upward in the event of upside break...
for those who have liked my posts...i'm delighted
for anyone interested in elliott...see www.elliott-wave-theory.com
happy trading!
stu
 

Attachments

  • snapshot-26.png
    snapshot-26.png
    65.4 KB · Views: 371
Don’t give up Wellshot! – it’s great stuff – just pace yourself and give everyone a chance to take it all in as the chart story develops! :D

On a more basic day trading note, I mentioned yesterday how successful trades can be made in a choppy/sideways market by entering/exiting trades on RSI PD & ND.

Clearly support was about 10445 with resistance at 10485 for most of the day, making for reasonably safe trades within a defined range.

I made three trades on the long side on the basis that I thought that the market was likely to rise.

Trade 1. was entered on the sharp reversal (positive in itself) near support on the basis that it was a higher low than the previous one,

Though most of the PD/ND was very short duration (apart from the exit to trade 2, where classic 3-peak ND developed over 60mins) it clearly indicated a tradeable reversal.

Not trying to pretend that all my trades are successful, but I love it when a plan comes together………. :cheesy:
 

Attachments

  • 31-01-04.gif
    31-01-04.gif
    21.9 KB · Views: 358
tradesmart,
Just wondering how you actually trade the DJI, spreadbet or direct access?
Thx,
hampy
 
Tradesmart

Great chart

PD/ND does this mean opposite directions. I found your entry & exit notes on the chart really helpful.

Can anyone give me any useful tips on thr RSI, as I still do not think I am understanding the signals correctly

Thanks

Kathy
 
Last edited:
Well I must admit what a terrible post that was I wrote, I think I must have typed with my hands around the wrong way!

:eek:

Now corrected I hope
 
CM

On your 1 min chart you have the price numbers on the right hand side going up in multiples of 5 e.g 10470.00 10475.00 Please can you tell me how to set this on sierra as mine seems to be in multiples of 10.

Thanks

Kathy
 
rustic, simply zoom in or out on the chart and the margin numbers will change.

the button ( >< ) is just under the file menu.
 
Hampy – I’ve got several accounts, but for current Dow trading I’m using CFD, which I quite like for it’s flexibility and I can make the bias work for me. I’m considering a direct access account and have been studying US Level 2 for some time, particularly Realtick and TradeStation. Some types of account may help, but the main factor in taking money out of the market is to get the right entry and exit points – simple to state, but not so easy in practice……. :confused:

rustic Kathy – I’ve learned most of what I know about Dow trading from ChartMan’s posts. PD= positive divergence:- price is falling, but RSI is flat/rising indicating a potential bottom / ND= negative divergence:- price is rising but RSI is flat/falling indicating a potential top. The example above works for a sideways/consolidating market, but it works slightly differently for up/down trending markets, so follow ChartMan’s daily analysis.

Mom, I’m using SierraCharts with a MyTrack data feed which I find quite reliable and cost effective – I understand that E-Signal is better, and may give it a try….

Good trading Y’all……. :cheesy:
 
Thanks Tradesmart

Your post has really helped can understand it more now. Had a look over a few charts brilliant.

You mentioned that it acts slightly differently in a trending market I do follow CM charts and will keep a closer eye on the RSI.

How does it differ in a trending market?

I wish I had understood more about PD & ND on Friday got whipsawed a bit, not like you your trades looked good.

Thanks for your help

Kathy
 
Last edited:
Top