Dow Intraday charts 26/Jan - 30/Jan

Ah well - it's intentions are clear now - a nice PD double-bottom showing on the 10 & 60 min charts.

The target of 10550+ remains imho - it may just reach it via the 'indirect' route! :cheesy:

often the case..... :confused:
 
Hi chaps - had to knock off after my last post - closed my long just in profit after frugi's triangle post.

Missed the bottom and opp to go long.

TS, looks like the 10min chart is better at picking the bottom using RSI PD then the 1 min.

Looking fwd to CM's analysis tonight - hope its a detailed one to show us where we all wen wrong :)

edit : Actually been thinking abt this on the train - haven't really stuck to the 100 MA rules for a while - maybe am paying to much attention to price TA - think I'm gonna start factoring in the 100MA more now.
 
Mom, gave myself a slapped wrist for going long at 17.50 - wrong time of day and should have seen that false breakout coming anyway - they always do it :mad:

And should have seen the PD double-bottom coming – virtually the standard format!

However, got it right at 19.30 ish with a long at 10445 and held on to 10515. I think 10550+ is on the cards (possibly tomorrow) and will be interested to see CM's downtrend lines.

There is no doubt that the 100ma has magic properties when used properly…… :cool:
 
WellShot I don't trade at £100 pp or anything like it. However, if that is your ambition, you can do it either through IB trading the e mini futures ( dow is 3$ pp, 1 point spread, ES $50 pp 1/4 point spread.) No limit on contract size so 50 dow contracts = approx £100.... OR through spread bet. Be warned, at that level with SB's you may get forced to do "telephone only " trading, especially if you get some decent wins under your belt...

Does tonight look like a "W"? Assuming it is, we have 570 as a target, getting us back into the status quo channel. Just have to wait and see. Will that PD deliver?
 

Attachments

  • dow 29-01-04 10.gif
    dow 29-01-04 10.gif
    38.3 KB · Views: 435
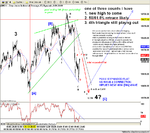
I've lost track of what you all did. As far as I can see , the flat bottom triangle that broke to the upside was a perfectly good long entry. That fact that it didn't go, is irrelevant. What is important is that you saw why and when it was time to get out.. First, the target was 495- never made it first time, or second time. It's valid to wait for the anticipated pullback, but there was a short term ND- the ones that Mom likes. It certainly was a very convincing break especially as there was the 100MA pullback.
Talking about the 100MA, If you got in earlier on the D top short, then the 100MA rules SHOULD have kept you in that triangle break as it only made 9 points above it. But then again, that PD bottom and triangle should have made you cover... tough decisions. None of them wrong.
If you needed convincing, that breakout was really weak on RSI strength- looking at that, look at all the early drops... They were all stronger that the rises, except the first one from 480 to 520.
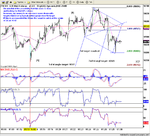
That bottom- recognise the 4 slope change? Confirmation from ES vol.- Short term divergence and then a blow off bottom at 2.5x vol.
The Inv. H&S off the bottom had a target of T1, easily passed, leading the way to a nice rise, being held on course by the 100MA and some weak RSI strength on the drop. Then on to the 3 PK ND top across 45 mins for an out.
And what about that snap breakout triangle? Target 502!
 

Attachments

  • dow 29-01-04 1.gif
    dow 29-01-04 1.gif
    27.7 KB · Views: 429
thank you

thank you chartman re:£100ppt-i admit, away from the screen, that my truest ambition is not to trade at £xppt but to enjoy my work! i work much more with elliott, having trained myself this last 3 and a half years-[i now only trade the dow follwing YM [e signal]as deal 4 free use the CBOT mini futures chart as a proxy for their daily cash dow]- i see yoiu're into chart patterns which i admit i need to use more [elliott can do your head in at times]
i'd love to join in more when i have something to say..foer instance.. i believe that we're in an expanded flat [X] with a minor new top to complete this wave then a new low [abc=Z] at 10370ish [or if the 5th of c extends, 10330ish].. this should complete A of 4 of this degree at the least and how we retrace to the top at 10700ish will determine whether this top is in for the next couple of weeks. there is no divergence on any indicator at the higher degree on any of the indices which suggests we're in a 4th with, indeed , a new top to come...that being said, i know traders on this board will trade what we see, not what we think!![sucking eggs, grandma, etc!!!]
now you can see why i don't post! all this waffle!
i'll put on a chart when i see how/feel it's right
thanks again...and IB confirmed this morning i should have an account open monday..who do you use? .. i also use deal4free. [
 
WellShot There are not many of us here that profess to know much about Elliot stuff. ( I know next to nothinbg).Your input would be more than welcome.
 
On the dow I see 10700 as a major resistance and any uptick towards 10600 i feel is opportunity for the prices to be hammered short. this is the hook up before continuation down. So im trading the market with a downside bias. I still take the longside just more aware that weve topped out.

I see a pull back to 9000 as likely objective from here.

jd.
 
I can see I’ve got a lot to learn about Elliot – can an accurate wave count only be done as a retrospective?

On a more basic note, the futures seem somewhat depressed and we have important data due at 13.30/15.00 – I often suspect that the market gets wind of the numbers in advance…….

I’ve drawn in some downtrend lines for my own guidance, and CM is right to question any positive assumptions and targets in respect of the potential,but not confirmed ‘W’ bottom – it could easily morph into something else…. :confused:
 

Attachments

  • 30-01-04.gif
    30-01-04.gif
    29.3 KB · Views: 311
Last edited:
your right!

elliott IS a difficult one..all depends on where the count starts!!!
targets are filled with unhelpful expectations which is one of the reasons ileft chart patterns a little and went for elliott which deals in probabilities - much more to my liking..once a wave count is secure, however, when to enter and exit becomes a matter of more rather than less certainty..i trade the one minute chart but work from the top down to pick up the feel for the most probable direction for the next day or more. chart put shows poss' down side IF IF IF my 5th[e] down comes off trade what i see not what i think, is my maxim, now! as it is exhausting trying to forever anticipate the market when i should be follwing it!!
 

Attachments

  • snapshot-18.png
    snapshot-18.png
    53.5 KB · Views: 317
apologies

those targets are for the dow mini futures contract and not the cash dow which are higher..
 
100 points spike on YM !!!!

With the data due at 2.45 and 3.00 any views an trading the first 30 mins?

My initial inclination is to stay out whatever. :(
 
Thanks Wellshot - I'll be a keen follower of your waves posts.... :)

Cynics corner:-I see that the futures have spiked down to 10378 with the less than scintillating GDP data........bet that took out a few stops...... :confused:

The over optimistic economists were wrong yet again....!

ps OES - The market is getting so many conflicting signals at the moment that it's hard to call in any direction, particularly in the first 30mins, but I think that the rule that usually applies is 'if in doubt - sell' - we'll see....!?
 
Last edited:
Head & Shoulders on the 10min chart with curent pullback to 100ema forming the right shoulder???
 
Long 10450 for recovery.......some better CC/PMI data...

The Nasdaq wants green today..... :cool:
 
Top