You are using an out of date browser. It may not display this or other websites correctly.
You should upgrade or use an alternative browser.
You should upgrade or use an alternative browser.
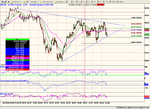
Some observations from the 60min YM chart :
1. Lows of today and 20apr can be connected with lows on 24march! (bullish triangle?),
2. Todays trading held just above the 75% retracement of apr 21-27th rally,
while
3. yesterdays' highs were more than 75% retracement of initial April decline
Meanwhile, the 10min charts clearly show many positive divergences on momentum indicators (ROC, RSI, MOM, MACD ?).
Bears have been BBQ'ing again but Bulls have not yet given up! Charts seem to indicate (at least to me) that there might be good (last) support at these levels (just below YM=10300). Those levels should, however, not be breached decisively)
CM, I would be interested to hear your view on current state of affairs. i still enjoy your charts. Shame that the following has dried up a little.
Mombasa, Tradesmart e.a. where have you gone?
Attachments
tradesmart
Experienced member
- Messages
- 1,286
- Likes
- 22
Not sinking just yet chaps........! :cheesy: (unlike the markets 🙁 )
Just wish that I'd held my short from 530 on Tuesday - these markets certainly appear to tank a lot quicker than they rise....
also looking for the edit button on my Dow Comp entry..... 😉
The 'Dow Theory of Parallel Trend Lines' (did I just make that up?!) seems to be holding good for now......
I guess that the question for today is "will 320 hold?".....we'll see soon....!
Attachments
tradesmart
Experienced member
- Messages
- 1,286
- Likes
- 22
just as well i got out at 10,400 - mind u went long again on the bull flag that bgold spotted and lost a few.
triangle broken so downside target 9600? Gulp !
Think i'll go short on the futures tomorrow at first opportunity and hold for a while.
mind u, the bounce at 220 was at the 61.8% fib taken from a high of 10,550 to low of 10K
just to add, the 10K low was the 61.8% retracement of the 10,780 highs on the daily so maybe todays low was the bottom for now.
Anybody?
Last edited:
Bill
Active member
- Messages
- 160
- Likes
- 1
Hi CM and all other followers of this thread.
I was getting a bit worried about the dwindling responses to this thread and thought I ought to post. CM I don't know whether the lack of response bothers you but just in case it does, I suspect there are an awful lot of people like myself that follow it regularly but feel they have little to contribute [anyone in the same position please post if you feel the same way]. Suffice to say this is certainly the best Dow discussion board and arguably the best full stop [although I might get arguments from some of the S&P and ftse crowd]. Anyway what I'm trying to say is don't stop! It's brill! And of course that goes for all the regular posters Bgold, tradesmart and Mombasa etc.
Ok. Would anyone be interested in my successes/failures. Doubt it but anyway. I did OK this week. I use a version of Cm's Dow strat and my own. Pd and nd seems to work OK but I feel a little understanding of market sentiment helps. This week it seems that the market has been concerned over next Tuesday's FOMC meeting and hence interest rates. I notice that good news has been translated into 'Oh but that might mean an interest rate rise' and hence either a market fall or a failure to rise. Sentiment is negative I feel. Yes I know easy to say afterwards but it did pay off this week.
So how is that related to the Cm's Dow strategy. All it means is that I was much more likely to take notice of nd than pd, i.e. sell on strength [ which I read somewhere else btw] Also I find the 100ema very useful and draw the + & - 15 lines along side this. Very very roughly speaking
1. On a down day sell when the price pulls back to touch the 100ema
2. On an up day buy when the price retraces to touch the 100ema
3. On a trending day buy at the 100ema-15 and sell at 100ema +15.
Of course a nice bit of pd/nd and RSI + or - 70ish help confirm the decision.
So what about next week? Could it be a case of sell the rumour buy the news? In other words a rally after the FOMC. That would fit in quite nicely with CMs talk of pd starting to take hold wouldn't it ? We'll keep an open mind shall we?
TradeSmart
I was just looking at your 'parallel lines' post and was wondering if it is time to start trying to fit descending parallels. Have we had the peak maybe?
Something Tom Hougaard said on Bloomberg a few weeks ago got me thinking. He was actually talking about the then recent rally in the markets being, partially, a result of the dollar weakness. i.e. I presume a company priced in dollars looks worth less when compared to other currencies so the market rallies to redress the balance. Of course that does mean that if the dollar strengthens the reverse is true. Background info - not a reason to trade.
Anyway hopefully this has padded out the thread a little
Thanks again to all contributors.
BIll
Last edited:
Yes well said Bill.
I too am an avid reader of this thread but my lack of experience prevents me from posting anything worthwhile thus I have only posted some naive questions on this thread in the past.
😱
I know it is time consuming for Chartman and the other regular posters to show their charts but it is so appreciated by people like myself who are still on the Dow learning curve and able to gain such priceless knowledge that would be hard to find in any book.
I certainly would like to say a big thank you for the knowledge I have gained so far and although just recently it sometimes may only be Chartman posting believe me I think there will be a large following of people who like myself cannot think of anything to post that would be of any value.
Thanks for all the time and effort guys - this is a great thread.
JayKay