You are using an out of date browser. It may not display this or other websites correctly.
You should upgrade or use an alternative browser.
You should upgrade or use an alternative browser.
C.M. I am following your charts with interest, can you please explain the significance of
the 32and 64 points? Regarding the current consolidation 10050-9850 the 60min chart
has the support being hit 3 times, is this an indication of strength or potential weakness to
the downside?
the 32and 64 points? Regarding the current consolidation 10050-9850 the 60min chart
has the support being hit 3 times, is this an indication of strength or potential weakness to
the downside?
It has been shown historically that 32 and 64 can be important decision points when trading the Dow. Don't ask me why, they just are. Mostly, that can be used to your advantage as to whether to open, close or hold a trade.
Yes, the more touches on a support/resistance line, the harder it will be to break. When eventually it does , it usually breaks out stronger.
Yes, the more touches on a support/resistance line, the harder it will be to break. When eventually it does , it usually breaks out stronger.
If you got caught on the drop, you probably weren't alone....But the PD and pullback to 40 ( close to 10 min support) should have been a good entry... Holding through that pullback to 60 could well have been too much to stomach at 30 points...but a near perfect bounce on the 100MA and 64 should have seen you back in if you got out.Then an out on the ND top at 80 for an easy 100+ with little more that 10 points pullback all the way through. Interesting how 10K just didn't seem to provide any resistance at all. The second RSI weakness should have had you looking for another long entry, rather than a short off the top. Remember, the ND top is not a signal to go short without good reason.... Not long to wait for the RS switch and the early break of the bull flag around 10064 and a long into the close.
Attachments
One Eyed Shark
Well-known member
- Messages
- 257
- Likes
- 13
CM
Appreciate the analysis and still read it every day.
If possible I would like to get your opinion on tick charts, I have been trading the EUR futs for the past couple of months using a 55 tick ( E signal ) though continued to use the 1 min to trade the YM.
Over the past few days I have run a 55T YM alongside the 1 min and so far have found it to give clearer and more precise signals, the main advantage being at times of inactivity it prints more concise flags etc. and when the market is on the move I have found pullbacks easier to call.
This may be a fluke but wondered if you have ever done any work on tick charts ? , obviously they are not available on the Dow only the futs but am I missing any potential pitfalls?
Attachments
Last edited:
Nephin said:Apologise for my ignorance but what does PD and ND stand for?
Thanks in advance.
further to C.M. reply , positive and negative div. refers to a divergence between the RSI
slope and the PRICE slope.
tradesmart
Experienced member
- Messages
- 1,286
- Likes
- 22
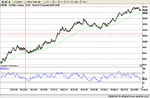
Difficult to predict the outcome of today’s tight ranged, choppy consolidation after yesterday’s big move, but overall looking quite bullish now imho, and a break north through the 100ema (if it gets that far…!?) will confirm impetus……
The old traders saying mentioned last week “the bigger the fall, the broader the bottom” seems to be holding good, with the current bottom (?!) comparable in breadth to the one that occurred in March; preceding a 570 point upleg…….. :-0
He might be right........ 😕
The old traders saying mentioned last week “the bigger the fall, the broader the bottom” seems to be holding good, with the current bottom (?!) comparable in breadth to the one that occurred in March; preceding a 570 point upleg…….. :-0
"The way oil bounces, so does the market," said Art Hogan, chief market strategist at Jefferies & Co.
"But I think we've really tested a bottom. Even if we sell off today, we won't give back all of yesterday's rally."
He might be right........ 😕
Attachments
Last edited:
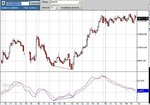
Today was a "lose your shirt" day for the unwary....with seemingly neverending whipsaws. If you managed to hold onto the 100mA rules, you'd have made 1 trade all day and stayed safe. For those of you that don't know about the 100 MA rules, search the archives.....
Attachments
dc2000
Veteren member
- Messages
- 4,766
- Likes
- 129
Anyone any thoughts on today I myself am looking for another big day with a dip after the open to 105 then target zone 220 for high and then coming down into tomorrow to finish 10100 level.
As always nothing in this post is an invitation to trade these are purely my own thoughts.
As always nothing in this post is an invitation to trade these are purely my own thoughts.
Similar threads
- Replies
- 52
- Views
- 12K