You are using an out of date browser. It may not display this or other websites correctly.
You should upgrade or use an alternative browser.
You should upgrade or use an alternative browser.
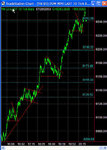
Make sure you keep updating trendlines, support/resistance every night on the 10 min charts. Sooner or later, a penny will drop and you will see where it's headed. I've numbered my iteerations 1,2 and 3. You can only do this with hind sight.Yesterday I said that if this was a 1 min chart , it would be a banker for a drop. Now the 4th low has failed to penetrate support, I can think about putting my bull hat back on and park the bear. I can now clearly see where the pivot point is for tomorrow........
Attachments
You can see the 10 min down sloping resistance line at the top of the chart. The second ND top just poked through resistance. This is the crunch for tomorrow. Nice easy 100+ points off the "W" bottom as it broke through the magic 64 to signal long, taking the exit on the third peak for just over a ton. 🙂
Notice the dual confirmation- T1 failed to make 9176 and the 3 pk ND top on the 3rd peak.
Had we gone to , say 9190, then it may have been worth staying in, maybe...
Notice the dual confirmation- T1 failed to make 9176 and the 3 pk ND top on the 3rd peak.
Had we gone to , say 9190, then it may have been worth staying in, maybe...
Attachments
So 9158 was the breakpoint. The fear of down has now gone and I'm looking to take out 9250... I said that failing to take out support on the 4th low was pivotal and so it has turned out that way although I had serious doubts as 9100 was tested twice. Nice performing "W" bottom though.
Attachments
Pont 1 on the chart was NOT the start of ND as CCI was still rising significantly. Not an easy day to trade early on and the long entry was hard to find. Double bottom, yes, but not always a good entry point.It was still a weak move up to 9140... The clue came in the weak dip to 9135 at 18:40 that gave 60 points.
A lot has been said about how much can be made per day etc. etc. and here's the proof. It requires patience and waiting for a good setup. Trading for the sake of having a position is a very good way to lose a lot very quickly. It does require extreme dicipline to stay away from the "trade" button. But the dow can provide a regular 50 -100 points for those that meet the criteria. If you can equate that to a risk of less than 1% of capital per trade, you will stand a reasonable chance of success.
The risk on this trade was 20 points below the 100mA at entry ( 9140) that's 30 points. at £2 a point that's £60 risk, so your capital needs to be > £6000. at £4 a pint you need to be looking at £12K+. So at £2 a point and 60 in the bag, you made £120 and 2% capital growth. You don't have to be a mathmatical genius to work out that if you can do this regularly, you stand to make a reasonble income/living.
Try the same thing/numbers with just £2K capital and you'll soon be needing to top the account up to cover your losses.
Attachments
bansir
Well-known member
- Messages
- 494
- Likes
- 42
ChartMan said:If you can equate that to a risk of less than 1% of capital per trade, you will stand a reasonable chance of success.
The risk on this trade was 20 points below the 100mA at entry ( 9140) that's 30 points. at £2 a point that's £60 risk, so your capital needs to be > £6000. at £4 a pint you need to be looking at £12K+. So at £2 a point and 60 in the bag, you made £120 and 2% capital growth. You don't have to be a mathmatical genius to work out that if you can do this regularly, you stand to make a reasonble income/living.
Try the same thing/numbers with just £2K capital and you'll soon be needing to top the account up to cover your losses.
Hi CM,
I think I see what you're getting at here.
Let me try a couple of simple examples....
1.
You have £3000 capital.
You're looking to place a trade with a risk of 30 points.
You consider taking a position at £1 per point.
This is OK since your system allows you to risk up to 1%
(30/1000) of your capital.
You exit 60 points to the good :-0
So you risked 1% to make 2% (60/3000)
Your risk to reward ratio was 1:2 (1:3 would be safer still)
2.
You only have £1000 capital
You place the same trade, risking 30 points.
You take the position at £1 per point.
This is bad news because you are risking 3% (30/1000) of
your capital.
You exit 60 points to the good- but it was emotionally a bit of a sweat to stay in; you were tempted to pull out at 20 points up.
Still you made it but you risked a huge 3% to make the 60 points. You are 6% (60/1000) up.
But, this was still a 1:2 risk reward ratio wasn't it?
------------------------------------------------------------------------------------
What I can't quite get my head round is that one's system can't 'know' how much capital you have so the increased likelyhood of failure for trading with low capital must be due to:
1. Not being able to cover the worst losing run.
2. Allowing emotion to influence your decisions as you risk larger and larger percentages of remaining capital.
3. Being forced to place stops so tight that they get triggerd every time.
4. Something I haven't thought of.
Is the above just rubbish, have I missed the point, maybe even THE point?? :cheesy:
Sorry if it's a bit basic for some.
Best Regards,
Neil
So 9158 was the breakpoint. The fear of down has now gone and I'm looking to take out 9250
Very sweet. 🙂 Very sneeky. Pretending to break down by failing to make resistance earlier in the week, then failing to make support and making my 250 target from two days ago. My comp target of 350 will no doubt come a day late yet again. :cheesy:
Very sweet. 🙂 Very sneeky. Pretending to break down by failing to make resistance earlier in the week, then failing to make support and making my 250 target from two days ago. My comp target of 350 will no doubt come a day late yet again. :cheesy:
Attachments
What on earth are people doing? I've been reading the goings on of other people...... how on earth didn't you make a bundle today or close early?
With a third bounce at 9100 and CCI coming off -200 it had to be a long.... and then following through to T1 and then T2 and finally closing on the 3 pk ND top over 35 mins. Wh cares that it went up a few more points into the close? I didn't. :cheesy:
I'd had enough by then. 180 points in the bag and a stroll in the park. No more than 20 point pullbacks and just a sniif at breaking the 100MA by a couple of points. Perfect test of the 250 resistance line, converting into support a few minutes later. I'd started looking for the ND top from 19:30, looking for it to top out at 250 res, but that was cancelled at 19:55. 20:13 gave the second peak after the 250 break and so on to waiting for the third and out.
Great late close at HOD leaves us with a chance of a good start to next week, no doubt making my comp target of 350 on Monday....as usual.
Attachments
F
ford
Why didnt you short after the pullback at 9145?
Why did myself and Newtron Bomb do this and what made you shy away.. Teach us oh profitable one.. 😆
Why did myself and Newtron Bomb do this and what made you shy away.. Teach us oh profitable one.. 😆
I'll let you into the secret of my achille's heel, and why I'll never make it as a top trader- I have a fear of going short.Simple as that. 😢
I stick by my general analysis of the market and I was clearly looking for a long today..... I have been known to go short, but not often. I know I miss a great number of opportunities, but there we are. I prefer to bottom pick and get out right at the top. What happens inbetween, I don't worry about.
Sad, isn't it?
Absolutely nothing wrong with your short entry at 9145....
CM, Haven't been trading recently for various reasons but have been following this and other threads avidly. Have found that with a much more relaxed approach I'm finding it easier to pick the safe entries.
Just one thing, looking at todays actions, I would have first spotted the 100 EMA break at around 16.50 and would be thinking about going long on the pullback, but then I would check RSI and that was just below 70 - that would have put me off and in hindsight would have been a mistake. I've noticed this on quite a few days - what's the lesson here?
Cheers.
You'll only have the balls once you have experience under your belt. Begin by placing a smaller stake on those entries that you are not sure about. Then, as the move progresses, in this case when it pulled back a second time to 9149 @ 17:30, build your stake to a "normal" size. You're now 20 points in profit ( ignoring bias) and looking safer. The clue here was CCI was close to 100 having come up through zero. If CCI was dropping from say 250, then the entry would be "risky".
Track the moves guaging strength of dips by the relative move in RSI. All the dips were RSI weak, so no reason to close, ignoring all other criteria.
Track the moves guaging strength of dips by the relative move in RSI. All the dips were RSI weak, so no reason to close, ignoring all other criteria.
bottomdollar
Active member
- Messages
- 217
- Likes
- 1
Chartman,
This is really good analysis.. what is T1 and T2??
Also, in another thread there is reference to one of your really early posts.. a year ago and you used the phase indicator (which I've never heard of). Is it a worthwhile indicator to use.. I note it's not in your charts these days..
Thanks
BD
This is really good analysis.. what is T1 and T2??
Also, in another thread there is reference to one of your really early posts.. a year ago and you used the phase indicator (which I've never heard of). Is it a worthwhile indicator to use.. I note it's not in your charts these days..
Thanks
BD
Hi all
Nice update chartman unlike yourself i cant hold in all day as soon as i hit a target i bail out, but over the past few weeks my trading is constantly improving yesterday was my best day ever i took 4 bites out he cake on the way up and its all down to patience and waiting for a pattern to develop as usual entered with a 10 point stop and virtually no draw down . have a good week end all .
Regards mark
Attachments
bottomdollar
Active member
- Messages
- 217
- Likes
- 1
Marky, great stuff
Those support/resistance lines... 9129, 9151, 9172, 9198 and 9242 on your chart.. are they previous peaks/troughs or Fibonacci lines (if Fib then where did you take then from??)
Regards
BD 🙂
Those support/resistance lines... 9129, 9151, 9172, 9198 and 9242 on your chart.. are they previous peaks/troughs or Fibonacci lines (if Fib then where did you take then from??)
Regards
BD 🙂