Second attempt🙁 lost the first one in cyberspace)
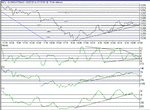
The dow got off to a bad start...momentarily dropping and recovering to 456, and then sliding to support at 400. A brief rise to 420 or so gave hope, but was just a short lived capitulation as it went on to fail support and drop to 380 and a double bottom test, before rallying to 450. Three attempts were made at breaking the magic 450/500 but each failed. Velocity plot showed each high was failing to go higher,leading to the inevitable failure of the attempt to break resistance, the final up-trend being broken at 442, having made a peak of 455.
The rally failed and proceded to go to support at just over the 400 level ( 50% retrace).
Five attempts at 400 support, and a rounded bottom, gives hope for next week that a solid base will be formed here,with early confirmation by pos. divergence on velocity on the lowest low(400) and previous low(403). This is further strengthened by the fact that there was no sell off at the end of trading, showing confidence in this level.
The attached chart shows a nice continuing up-trend from the low of 210. Notice where the slope correction is from 304 low to today's end,after the slope increase from the low at 304 to the low at 400. this was due to the sustained and eventual failure of the retries at 450.
All indicators on the 15 min chart were just turning up at the end of the day, reinforcing the dow's final position.
What of next week? I don't know. I see a continuation from today's close, to retry 450/500 again. The 400 point support is crucial for the continuation of this rally and everything hinges on that value.
What of the neg divergence on velocity at the end? Well a down trend line, confirming the failed high at 454, was broken just before close, so I think that's a fake.....

