FetteredChinos
Veteren member
- Messages
- 3,897
- Likes
- 40
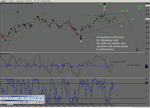
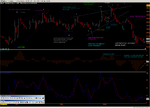
10,880-900 and down chaps... 😉
might well hit it in the normal session at this rate.. possibly overnight though.
bradley turn date on the 16th.. been accurate for the past couple of years give or take a day...
might well hit it in the normal session at this rate.. possibly overnight though.
bradley turn date on the 16th.. been accurate for the past couple of years give or take a day...