You are using an out of date browser. It may not display this or other websites correctly.
You should upgrade or use an alternative browser.
You should upgrade or use an alternative browser.
tradesmart
Experienced member
- Messages
- 1,286
- Likes
- 22
One Eyed Shark
Well-known member
- Messages
- 257
- Likes
- 13
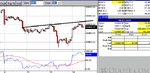
Possible inv H & S starting to print on the 10 min.?
Would result in a bounce at 450 / 60
Would result in a bounce at 450 / 60
One Eyed Shark
Well-known member
- Messages
- 257
- Likes
- 13
Mom
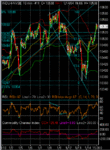
what I am looking at started on the 9/01/04, left shoulder and head now formed, potential of right shoulder in the making with a neck at 10500
what I am looking at started on the 9/01/04, left shoulder and head now formed, potential of right shoulder in the making with a neck at 10500
One Eyed Shark
Well-known member
- Messages
- 257
- Likes
- 13
Caution , We could see a move just after 19.00 , Beige Book is out at this time and could be a catalyst in either direction.
JE my money is on a bottom being formed , but any break below 480 and I will be short
JE my money is on a bottom being formed , but any break below 480 and I will be short
tradesmart
Experienced member
- Messages
- 1,286
- Likes
- 22
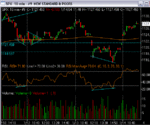
Just closed long opened at 10380 yesterday at 10550 as the futures spiked up just ahead of Intel’s earnings….suspect this is going to test 10600 soon, but enough is enough (for now!)..
10min chart pattern resembles H&S with left arm reaching north……. 🙂
I don’t very often hold overnight as I prefer to trade what I can see, but my main criteria was that I would not incur a loss, and as the index had moved fairly well north of my entry at the close of yesterday, I was able to set my overnight stop to lock in a small profit – so risk was minimal/reward potential was ‘plenty’…
Trade was entered on the basis of PD bottoms on major indexes after what I thought was mainly a ‘technical’ sell off yesterday (nothing had happened to really ‘spook’ the market) and a bounce off the lower downtrend line that CM defined (also previous support level to a tanking market 2/1/04)
Other reasons:- 5th wave down on the 10min chart and yesterdays consolidation pattern between 10380/10430 gave a potential 50 point target north – sufficient to break through the upper downtrend line…..and so it happened….
Sometimes the plan comes together – but not always….! 😕
Attachments
Can anyone recommend a book that explains in good detail, covers the basic indicators and explains chart signals.
Any information would be very much appreciated.
TS - Good choice on closing long afterhours. The futures have just went from 10555 to 10510 (cash).
Any information would be very much appreciated.
TS - Good choice on closing long afterhours. The futures have just went from 10555 to 10510 (cash).
One Eyed Shark
Well-known member
- Messages
- 257
- Likes
- 13
Struggle to understand the logic of this market sometimes.
Intel comes out with figures in excess of what is expected and
1. The stock declines approx $1.50 ( c 5% )
2.YM Futures drop 50 points
Gave up trying to trade the news a long time ago but can anybody shed some light on why the market has reacted in such a way ?
Intel comes out with figures in excess of what is expected and
1. The stock declines approx $1.50 ( c 5% )
2.YM Futures drop 50 points
Gave up trying to trade the news a long time ago but can anybody shed some light on why the market has reacted in such a way ?
tradesmart
Experienced member
- Messages
- 1,286
- Likes
- 22
JE/OES The Intel/Yahoo/Apple results appear good, but they always sell the news - even after hours - so predictable! :cheesy:
JE- Just for the record, I've learned most of what I know about Dow type t/a - indicators etc from CM's daily analysis...but maybe he can suggest some other relevant reading..
Regards
ps - I've found my self short on long days several times, but paid the 'tuition fee' (quite high!) and learned the lesson.. 🙁
Similar threads
- Replies
- 74
- Views
- 14K
- Replies
- 0
- Views
- 2K
- Replies
- 10
- Views
- 6K