Dow Intraday charts 12/Jan - 16/Jan

Well, the indexes seem to be recovering a few points now, S&P and Nasdaq also have PD double-bottoms on the 10min charts...

closed 1st long on sudden reversal at 10425 - now long again from 10380....

food for thought - is 140 points the 'going rate' when the Dow tanks - we've had three of that order in the last 8 sessions - volatility appears to be increasing....!

ok if you're on the right side of it...... :confused:
 
AnMo I have little experience of ES Volume, so I don't know. Skim is the expert.I'm no wizz kid, I just look for clues that show time and again that give me confidence in the decisions I make.I don't profess to understand why either. Iy you bang your head on the wall hard enough and long enough ,one or two things will happen. For sure the pain will stop, but is that because you stopped, or because you're unconcious? Secondly, you know next time what will happen if you do it again. :cheesy:
 
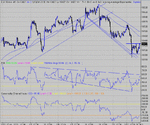
OK Guys. Go back and look at the 10 min chart I did last night. It will show you the importance of making, at least, an educated guess of where the likely channel lines will be.Now look at tonight's 10 min chart. I have drawn in 3 lower channel lines with the benefit of hindsight. If I chose any one of them last night, how wrong would any of them have been? This leads on to an important issue. In drawing trend lines, people will say I do it wrong, it has to be done so and so way.The general consensus is that lines should all touch highs or lows. Wrong. You should take a "best fit" and take one line, support OR resistance, whichever one has the best fit or most "probable" touches. From this, draw the opposing line parallel. 9/10 you won't be too far wrong. My estimate of support at 380 wasn't that far out, considering the move of 140 + points.Close enough to have the confidence of an expectation of a bounce/reversal/stop at that point. So in that area I know to look for a close on a short. Again, I must stress, that does not mean a reversal.. The Dow has a nasty habit of consolidating at tops and bottoms, when we're all looking for a reversal.
When the market has violent moves, don't bank on the magic numbers working too well. Nothing can stand in the way of a mud slide! Next horizontal support down is 300. That ties in with my bear flag target mentioned earlier....That target is cancelled. For now. Still not a lot of room in RSI for upside. Resistance is at 59 ish... For upside, we have to get back 432, then 464 and then we'll be at channel resistance. In case I need to spell it out, we're in a down trend....
 

Attachments

  • dow 13-01-04 10.gif
    dow 13-01-04 10.gif
    35 KB · Views: 716
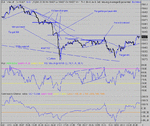
Lots already discussed today. Only tricky point was the false breakout of the triangle.... How to avoid ? by seeing the duplicate in RSI. The most successful ones are those that have the 3rd low above the rising support line....So much to learn,so little time.
 

Attachments

  • dow 13-01-04 1.gif
    dow 13-01-04 1.gif
    28.3 KB · Views: 685
Thanks for the above CM; a few questions spring to mind:-

1. We’ve had 3 touches of the bottom downtrend line in 3 sessions – does this increase the possibility of a rise to test a breakout of the top line?

2. Depending on whether you count the first consolidation on Friday; did we have the 5th wave down in the downtrend today?

3. Could the downtrend channel constitute a bull flag with a target of 10600 ish?

Regards and your bullishly
 
Theory say, the more touches,the stronger the situation...
Yes, I make it 5, not that I'm a wave counter, except on 1 min charts.
I make it 11,400 :) :cheesy:
Take a look at a "line" chart on the INDU.... take a look at all the pullbacks since March.... are they all abc corrections? The worry is that the c legs are all longer than a. So do we go down to 300 and then up? Could also be H&S, or both.
 
Thanks CM - just trying to get a feel of the prospects for my Dow Comp entry this week...... !!!:cheesy: :LOL:
 
cm C waves arent always longer than A???


edit: although I have to add it's more likely than not
 
Last edited:
Hooya.
I'm no expert on waves. I see that there are excellent discussions on the FTSE thread about this. I just made the observation from the daily line chart of the Dow. I base a lot of my analysis/decisions on patterns and their repeatability. Pls note my comments are always relative to the Dow, nothing else. Whether or not any of my ideas work for another instrument is another matter entirely. Your comments and input on waves could be interesting....
 
cm, I am no expert on wave counts either:) but of what I have seen C waves usually eaual A or move to 1.318 or 1.618 x A. How ever there are flat correction where C migt fall short I think, but
I am still learning that bit.:-0
 
Is this gonna break to the upside and test 500? Sitting above the 10 min channel res.
 
Held long from 10380 overnight, and still in for now - seems bullish….!

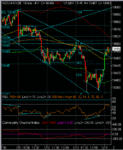
Yesterdays consolidation target (64 ish points?) has delivered right on cue, and taken us north of the upper downtrend line…….

Sometimes the overnight risk is worth it if you can set your stop to breakeven + :)
 

Attachments

  • 14-01-04.gif
    14-01-04.gif
    19 KB · Views: 497
TS - I tried a cpl of shorts at the highs - closed them for a few points. Seems kinda risky going long at the mo with the RSI divergence.

Short again at 10490.
 
RSI channel just dipped, but looks marginal... ES is two triangles back to back...just about to break..
 
Keep a tight stop Mom. the 3 pk nd hasn't dropped...it's 480 short 500 long for me.
 
Going by the consolidation, I make the target 10530 ish, but then, I'm long and biased... :cheesy:

could be wishful thinking.. :confused:
 
Maybe.... but I think today will be hard and tight stops or sit on hands is required. That or stake reduction..... and wider stops. Vol is really low...
 
Top