You are using an out of date browser. It may not display this or other websites correctly.
You should upgrade or use an alternative browser.
You should upgrade or use an alternative browser.
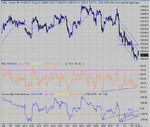
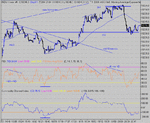
W target came nowhere near before it developed into an H&S offering a good short...Right shoulder under the 100MA and a pullback to the support line added strength to the argument, allowing an easy entry around 250. Out at the second try at 203? maybe.... If not, definitely at 17:21 at 210 on the 3rd trough. Now looking for a long or short.... and the bad news was the bear triangle break, inviting a short with T1 as target. Not a good trade, but you don't know that at the time..... at least the break back through 200 failed, and with the PD at 192, you should have taken the opportunity to exit for a couple of points, and even a reversal....risky... better to wait and see what develops...taking a long at the 210 pullback with T2 as target from the prior divergent W bottom, exiting as the price reverses off the 10 min downtrend resistance line and divergence.
Attachments
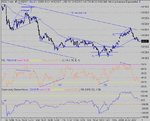
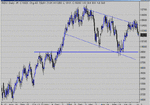
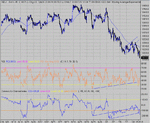
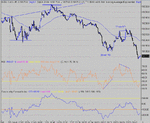
You can see from the old 10 min res that when it broke, there was a nice run... It is important to know where the 10 min sup/res is...It may give you the confidence to increase your stake size a little, maybe...And had you done so, was there a place wher it would have made sense to add to your stake? And if you did,where would you start off loading? The magic numbers played an important part of the decision making today..especially as the "theoretical" expectation was to make 280 as a target on the break. The ND around 64 could only mean one thing.
Attachments
Hi CM and all
From yesterday you asked about adding to your stake. I assume you meant at the pullback to 232. didnt do it myself, too early in my learning stage. once i'm in i just try to get best exit (usually wrong).
However, many thanks for your postings, they really help me. like to compare my charts at the end of the day with yours. keep up the good work.
Glenn
Experienced member
- Messages
- 1,040
- Likes
- 118
ChartMan said:Oh dear. Just as it looked to be turning.... This now looks like 10K...
Possibly.
It is also at 50% retracement of rise from May, right on the nose.
Now have to wait to see what the next consolidation, bounce or fall looks like.
Downward momentum has been pretty steep recently.
Glenn
Ema ?
Hi Chartman
What EMA period are U using in your graphs? Is it 100 days or am I confused (again!) ?
Thanks in advance
Smiley
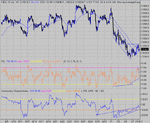
ChartMan said:Same story, down to support, off to the magic 64 and down...
Hi Chartman
What EMA period are U using in your graphs? Is it 100 days or am I confused (again!) ?
Thanks in advance
Smiley
Hi CM hope your well. Always like to read the weekly dow thread, interesting to look at your TA and learn from it. Today was a tricky day for me. I started the day with a long on the dax, took 20 points then stayed out of the dow and dax for the rest of the day. Probably could ave shorted the dow off the ND i saw at 10245 but thought better stay out of it as i wasn't confident on the trade.
I have been studying TA alot - reading some books and trying to get as much practise as i can before risking money again. One problem im having though and i can't seem to solve is good entry and exit points to maximise profits. I seem get the direction but time the trade wrong. Any advice? Any good places to look?
thanks
hammer :cheesy:
Similar threads
- Replies
- 12
- Views
- 5K

