Dow Intraday charts 04/08 - 08/08

ChartMan

Legendary member
Messages
5,580
Likes
47
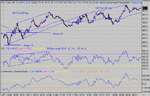
Great day, especially if you got in with an early short... The first target was an easy call at 9080 but it sucked some into going long. Not a bad choice seeing as there was a double bottom and some pos. divergence.Not the best choice either as the divergence was only short term at that time. Watching the price rise off the double bottom needed a close look. After such a big drop, what was the reason for the change? Well none actually. The RSI /price ratio on that rise was around 2:1 signifying a weak move up. SRI went from 20 to 80 but the price only went from 9080 to 9107- 27 points V 60 in RSI.That is why the price dropped below 9080.
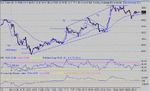
Picking the bottom was a lot easer than it looks. There were three calls to get it right. ( after the H&S delivered...)
1:- The triangle to the left side of the H&S had a target of 9053
2:- The pullback, taken on the right side of the H&S had a target of 9050
3:- NOW the PD was across 35 minutes (15:30)
Oh, and I'll add in the RS switch as a fourth.( not to de relied on on it's own)
Now, SunSeeker called a turn after 30 mins( apparently). And it looked like it would be the case..... But in this game it's a case of fools rush in. I have to say that it did look a good bet on the face of it. Back support ( horizontal ) was at 9080 and RSI was down at 20... So you are forgiven if you went long here.
Should you have waited to see if 9100 was going to beak /fail? Well it broke a bit so you may have been tempted into a long here as well. Plenty of reasons to go long, with no real reason not to...... Except patience.Having waited long enough to see if 9100 broke, you SHOULD have spotted the weakness from RSI.
So having waited, the real bottom was an easy call as I said earlier. The rest was a stroll in the park. I've shown the major targets on the way up , T1,2 and 3. The out was a thinly disguised 3 pk ND top, and if that didn't convince you, the following double top at 9207 should have done! A straight 150 points. The frightener , I guess would have been the 50 point pullback from 9170. Difficult choice. BUT the 100 MA was only broken by 10 or so points.
IF you got in on an early short, there was 200+ on the table today. But then I don't do shorts....usually. :(
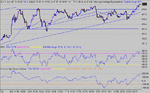
SunSeeker's calls are uncanny. I've been watching them for a while and taking note. My only word of warning is don't follow them blindly. Use your TA skills in conjunction the the predictions and take a balanced view. That should up your points nicely.
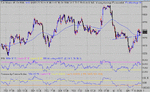
 

Attachments

  • dow 04-08-03 1 mina.gif
    dow 04-08-03 1 mina.gif
    23.6 KB · Views: 674
Inv H&S target 9250.......
 

Attachments

  • dow 04-08-03 10 mina.gif
    dow 04-08-03 10 mina.gif
    27.9 KB · Views: 673
The Clash of the Gurus!

Sun does not use any of the methods that Chartman uses! It is interesting to watch these fundamentaly diferent approaches. Neither has any call to be the final answer but both are effective in there own terms. But both inform the debate!

Play on :)
 
Instant cancellation on the Inv. H&S so that's that.
The opening wild triangle should have rung alarm bells... stay out. The following bear flag failed to deliver and so we came off 9100. That was short lived too, with a quick ND top that had gone nowhere. Note the weakness in RSI that led to the down fall and once 9100 went, that was the kiss of death.
 

Attachments

  • dow 05-08-03 1 mina.gif
    dow 05-08-03 1 mina.gif
    21.3 KB · Views: 628
I really enjoy these charts.. really nice to look back on it and make an objective view on how you should have viewed things!!
You're da man Chartman!! :)
 
Not a bad day, with many thinking doom and gloom. :) Even with all the experience I have, I wish I could find some definitive rules as to when the open PD will work , and when it won't. Today it did, normally it doesn't.
What can I say... T1 and T2 delivered, T3 failed. What a suirprise- it was the 3rd pk on an ND top. A nice ride all the way up the 100MA, just dropping through by a few points. ND top or double top out as a few days ago for 100 odd points. Waiting and taking a short as 9100 lost support was worth another 30 odd.
Now there's another Inv. H&S to test on the 10 min chart.
PS if the ND top is not clear on the dow, It's very clear on ES...
 

Attachments

  • dow 06-08-03 1 mina.gif
    dow 06-08-03 1 mina.gif
    22.9 KB · Views: 595
Hi Chartman, et-al & AIQ users.

Can anyone enlighten me - where can I find the ES (emini S&P 500 futures) chart - if any - in the AIQ package or anywhere else for that matter. I mainly use AIQ 'Real Time Charts' is there a symbol to receive this chart?

Also, where can you find volume for the same. As mentioned in Chartmans summing up on 31st.

Thanks,

Zebra.
 
emini dow on AIQ/Track is Q`U IThe S/P mini sept is ES`U, but you will need to enable exchange if your not getting live
 
Chartman - Like your 100 ema and Bonsai`s 1 hour MACD and have been experimenting with MACD and came up with 1 minute 60/100/5 setting. Bonsai likes it and has adopted it on his FTSE MACD setting but I wondered how it worked with the DOW. I actually trade the FTSE using the above D4F MACD setting on their charts, whilst I am learning, but would like to trade the DOW eventually. Any thoughts?
 
Hi CM,

Any chance of you marking good entry points in your charts, so that we can compare with what we did?

Cheers
 
Why don't you tell him what you did and then he can pull you apart. You'll learn much quicker - believe me
 
I do, and he does (sometimes) - been ok recently although not doing too well today.
 
Those MACD setting look promising, but , if like me you have something that works, don't change. Research it in the background and ensure that you understand how/why/when it does or doesn't work. Never dismiss someone's suggestions out of hand.....nor take it on board "as is".
Yes , Mom,I haven't posted any "safe" entry exits for a while. I thought most people had got past that stage. :)
There was a nice long entry at 15:41 that I took today( a bit earlier actually) and made 53 points on the DOW. I went long on the bounce from the 10 min Inv. H&S. Other than that it was a poor day. With the bulk of the action being within the 100MA +/- 20 band, I guess there would have been a few peeps getting whipsawed today.....
Perhaps a better day tomorrow and a step closer to my guess on the DOW comp :cheesy:
 

Attachments

  • dow 07-08-03 1 mina.gif
    dow 07-08-03 1 mina.gif
    23.5 KB · Views: 427
Chartman,

I had entry at 16.10 on the back off RSI:price ratio compared to previous down trend move, was it a valid entry or a lucky 20 pts ?
 
I got the inverse h&s entry but after that it was a bit of a disaster. I couldn't make my mind up about the exit point on the 3rd peak at 16.40 - on CM's chart its clear that there was no ND, but on Lycos the RSI peaks were lining up as flat. Decided it would be safest to get out.

Looked at the chart again and though maybe it wasn't ND and went long - as soon as I did that the price started dropping. Ok, the move was weak so I held on until it started approaching the 20 below 100EMA. Aha, I thought, will save myself a few points and close 'cos it's bound to drop past the -20. It didn't. Never mind I though, is that a bear flag forming (17.40)? Shorted it - up it went!

Closed the short at 100EMA + 20, went long etc etc etc.

Lesson learnt - don't anticipate the drop through +/- 20 from the 100EMA - wait until it does - and don't look at the spreadbetter price - it'll spook u. I've been guilty of this 'anticipation' the last few days and been bitten everytime. Otherwise, today I could have made 50+ points like CM.

Also, get a decent charting package if and when I start doing this for higher stakes - Lycos is ok, but messed me up today on the RSI.

CM, was that a potential bear flag at 17.40? Also, on my entry points request, would still find those useful - especially if they are anything other than the 100 EMA pullback ones.

BTW, whoever voted for me - thx :)

Cheers
 
Obeyed the =/- 20 "do not anticipate" rule today and it paid off - bloody difficult to hold your nerve though when the dow drops 40/50 odd points in a few mins and get so close to breaking 100EMA by 20. BTW, had the same RSI scenario with Lycos as yesterday - this time decided to get out of long on the treble top at 9180 - went short for fun and closed a few points profit.

Hey CM, I might just make it u know :)

BTW, is that an ascending triangle forming on the 5 min chart, flat topped at 9180? Could be a good position to hold over the w/e - if one had the nerve - which I don't :)
 
Last edited:
Great Mombasa. It pays to be patient. You'll only lose a few points, but you'll greatly increase the chance of a winning trade. Take a guess and you greatly increase the chances of a losing trade. Wait for the 3rd peak on a bear or 3rd dip on a bull flag.
Just remember that the rules are NOT cast in stone- they work well, but nothing works all the time. Go back and check the RSI strength/weakness on the previous move to your entries. Did you go with strength? i.e was the down move prior to your long strong or weak?
VIII your entry looked ok to me...
Today was another one of those nasty days. I had hoped for the triangle break to 9220 but it didn't deliver... and was never likely to with RSI very weak in both directions. If you stayed out today , well done. If you didn't, I guess you stood a good chance of the whipsaw..... After 3 tries at 9180 from a baseline of 9140 I decided that the only hope was the triangle that didn't go. Nil Pwan. :)
 

Attachments

  • dow 08-08-03 1 mina.gif
    dow 08-08-03 1 mina.gif
    21.7 KB · Views: 244
Top