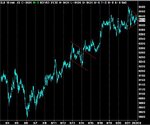
Dow Intraday charts 18/08 22/08

ChartMan

Legendary member
Messages
5,580
Likes
47
Seems like a nice start to the week again. Good example of how/when to take the profits and walk away.
Two possible safe entries, ont at the pullback just after the H&S failed to deliver, the other shortly after at 9364.... Minimum risk, target 9400. Second target 9423...not quite met but close enough and you should have been out right at the top. You can be excused for getting out at 9410 on the third lower RSI peak. No way of knowing there was going to be anther little blip up, except the expectation of making target T2, but that invoves greed and guesswork. Take what you know works and be happy. Crying over the last 10 points is pointless.....
Then going long or short would have given a losing trade, either way, unless you were very lucky.
The drop in RSI of 80 to 30 after the top showed weakness in a down move.... the 30 to 80 move in RSI for 10 points showed equal weakness in the up move. What does this tell you?
In case you can't figure it out, it says the market doesn't want to go anywhere. Have a long cuppa tea...... :cheesy:
Where do we go tomorrow? No idea. I need to read my Friday report again on the 10 min chart. :cheesy:
 

Attachments

  • dow 18-08-03 1 mina.gif
    dow 18-08-03 1 mina.gif
    21.5 KB · Views: 758
Now I remember.... We either go up, or down.
We've broken the recent high of 9350, and we retested it pretty convincingly. We're still in channel , so nothing major here. Horizontal and channel support are converging at 9350, making it tougher to break on the way down.RSI and CCI are developing into a potential RS switch. If this holds, then maybe the uptrend will get stronger. Without predicting, HE who said 9600 was on the cards may get an early christmas present ( he said 2 weeks I think),and may have the last laugh. AND I thought 9466 was a tad optimistic. :cheesy:
Who cares why it should or should not get there? Overvalued , Undevalued. Just trade what you see, as always.
 

Attachments

  • dow 18-08-03 10 mina.gif
    dow 18-08-03 10 mina.gif
    32.8 KB · Views: 767
I got in just as the rhs of the h&s was forming - didn't spot it until after I pressed the buy button - was kickin myself and planning my exit as it started breaking to the downside, then saw RSI was low as it approached the 100MA and went long again, doubling my stake.

Exited at approx 15.55 @ 9400 'cos I thought that was the 3 ND peak - took the opening peak as the first one.

CM, I'm still unsure about my entries when the price opens above the 100MA and slowly drifts down towards it - ie no clear cut breaking the 100MA about to happen. What criteria applies for a long entry in this scenario, ie at what point would one go long if there isn't any other TA formation to base upon?
 
I said where the two safe entries were..... it's never easy deciding just when to hit the button.... You just have to look for clues and make a decision, as you did, and then manage the trade, just as you did. Nothing wrong there. 10 out of 10 for realising you could have made a mistake.
As for the ND top, the second dip on RSI at 9475 was too low. Almost always, the RSI will form a perfect trend line, not deviating by more than a few points. You should be able to see that from the trend line I drew across RSI....
 
Movin on up.... The RS Switch hasn't done too well, BUT CCI has gone the same way now with a better possibility of delivering.You can see the weakness in the drop.... Still sitting very nicely in the channel, testing support again today and just managing to close above horizontal support at 9410.
 

Attachments

  • dow 19-08-03 10 mina.gif
    dow 19-08-03 10 mina.gif
    31.9 KB · Views: 691
Hardly a good ND top from the open, but the target of 9450 wasn't met on the middle peak. Another clue was the upper resistance from the 10 min chart- 9447. - Surely time to go short? Not an easy day to trade,except coming off the bottom at 9354 for an easier 60 odd points....
 

Attachments

  • dow 19-08-03 1 mina.gif
    dow 19-08-03 1 mina.gif
    22.4 KB · Views: 678
the channel support from the 10 min has been really strong but looks like today is the day it will break
 
nah - just had a 3PD divergence - don't think it'll break 9350 now - either up or flat for the rest of the day - anyway that's what I reckon - am out now for the rest of the day - better do some work :)

oh yeh - a tripple bottom too.
 
Last edited:
Well, the channel support did break , just, but held on at the close. Whether it will fall over tomorrow is open for discussion. Clearly, from the charts, there is well defined support in RSI and CCI. From that we can base our trades on the failure or otherwise of that support. In the final analysis, it will take some careful analysis of the strength of RSI on the 1 min chart to guage whether we will fail or not. The triangle that hsa formed should lead to a 100 point or so move inwhatever direction the market wants to take it, so it looks like a nice setup for tomorrow.
I've seen the discussions re overnight holdig and tonight is one of those nights where a gamble will pay off or hit you hard. NOT for me.
 

Attachments

  • dow 20-08-03 10 mina.gif
    dow 20-08-03 10 mina.gif
    31.8 KB · Views: 567
Not so interesting, BUT an open PD that delivered after 80 minutes. Unusual because we normally see multiple peaks from the open, making it impossible to call a bottom. I've changed the timescale by one slot so that you can see the importance of the previous day's trend line continuation- resistance down slope. The up slope shows the main 10 min uptrend support line.
There are a clear cut long/short entries for tomorrow, bounded by the two diverging trend lines. Get it right and I think there will some nice moves on the table.
Short below 80 , long above 20?
 

Attachments

  • dow 20-08-03 1 mina.gif
    dow 20-08-03 1 mina.gif
    26 KB · Views: 547
you were bang on with the break today - even got a nice little bounce off the top of the triangle to help the nervous amongst us - I feel I need to give you 10 pts as some kind of fee!!!
 
Not quite a 100 points, but not so far off. There a definite signs of weakness now in the moves up, but then again, it has happend a few times in this up channel. Still bouncing off support and still we must wait for the channel beak defore jumping on the short bandwagon. I personally think it's harder to call directions, the further out in timescales we go.... But does that actually serve any purpose? The only purpose I can see is goung long on every bounce off 10 min support and shorting every top near resistance.... knowing where they are intraday is very important.
Perhaps I should mention- it almost always serves no purpose to carry over RSI and CCI trend lines UNLESS the market opens flat.
 

Attachments

  • dow 21-08-03 10 mina.gif
    dow 21-08-03 10 mina.gif
    31.1 KB · Views: 450
One of those days when you can do really well, just so long as you did your homework. Las night I gave the long short entries...9420 9380. I've shown the two long entry points. The first after the dip from 9425. The second, for those overcome by fear of hitting the button, was the next pullback at 9440. Now for this entry we have a target og 9480,and THAT is 10 min channel resistance and a close whatever when we get there. The chances of a continuation are by definition MINIMAL, because of the long standing upchannel resistance line. Take the trade and profit and look for the next trade. Not long coming, with the double top at 9480 and so into a short entry. Managing the trade was a bit tricky, but helped by watching RSI strength on the up move- 30 RSI for 20 points up showing weakness. I realise that 20 points is probably more than a lot of people's pain threshold.... I admit it's easier with the previous trade's profit in the bank. Perhaps that's not the right frame of mind/attitude to take..... But you have to work out what's happenenig , as always, instead of being frightened out of the trade just cos it's move against you. Assuming you got in at 9470, that's all it pulled back to, even though the SB price may have offered over 80. Never take any notice of that. Apart from any other arguments, they can move the price to "shake the tree" and frighten you out of the trade. Getting the exit was definitely not easy, but guessing RSI 11 would have been profitable. 1 min ES volume was divergent here so those that can see ES will have the edge without a doubt. Going long straight away would have probably cost you a whipsaw out... as would the sensible long at 9420 again. I've know idea how you can avoid this. It's a case of right decision( basically) but market thinks otherwise. Maybe more tree shaking....
That's enough for tonight. save to point out the RS switch in the price at the close. Another 100 point triangle has developed and we could see that go to 9500 + tomorrow. Personally , I'd like to see it close around 9462 .... :cheesy: Or should that be 9464?
 

Attachments

  • dow 21-08-03 1 mina.gif
    dow 21-08-03 1 mina.gif
    23 KB · Views: 482
Okay, opinions time :cheesy:

This is a chart of DJI : I think there's a bit more upside to come here, probably to mid 9500's, my reasoning being this:

Right in the middle of the chart, theres a pretty clear bull flag, the top of which is 9321. Down to the base of the pole gives us 8996, a difference of 325 points. Pop that 325 onto the lower end of the flag at 9217, and that gives us 9542 as a target, right?

In addition, the sym tri created by yesterdays action gives us a target today (assuming a breakout around 9440) of 9536. So, pretty close to the 9542 target gives from the earlier flag, dont you think?

Place your bets please!
 

Attachments

  • flagandtarget.jpg
    flagandtarget.jpg
    61.3 KB · Views: 434
I got it completely wrong! Had been out the night before and guess I wasn't quite on the ball :(

Took a chance and went long 10 min before open at 9449 - thought the rise would be fast and furious - nope - would have been better waiting for an entry after open. Anyway that got me on edge a bit as it dropped after open - set the tone of the day for me unfortunately. Anyway watched it rise to 9480 and was feeling happier - didn't think about the top channel resistance - thought it would get to CM's target of 9550 so didn't close - was waiting for some kind of ND to form.

Doubled my long at 9460 on the drop 'cos price/rsi looked weakish - walked away for a bit (to get rid of my headache), got burnt by the huge drop whilst I was away - didn't have the smarts to close in time and go long at the bottom. Next mistake was not closing at 17.30 when it shot up again - my analysis was still not working ! Hoped (as opposed to analysed) that it would go up more, only to see it drop again. Got completely fedup now and just left it till got closed out at the end for about 50 point loss.

Too think I was feeling quite pleased with myself this week until yesterday.

Urgh !
 
Chartman

On the 10 min for Supp/res I am having difficulty with is it the top & bottom of the channel? is the supp 9400? what is the res as the channel goes of the page. I am always looking for straight lines horizontally.

Thanks

Rustic
 
mombasa I recommend using a stoploss and when a trade goes against you it won't hurt as much.
 
So, we got to 9500 and not a point more... and then spent the day firstly dropping the channel support and then closing at LOD, to firmly signal the channel break. I got caught out on the first pullback going long at 1010 (ES) and taking a 3 point hit. :( Then it was a long wait to taking the short as channel support was lost at 9420, but that cover my loss nicely. Probably a classic case of thinking the market was going to 9550.... instead of wating until 9500 broke.... Such is life. That short stayed under the 100 MA for all of the rest of the day, and a nice few points in the bag. Maximum pullback was limited to around 20 points or so and that should have made it easy to stay in the trade.
A glimmer of hope around 8pm for those looking for a long, as the RS switch developed, but promptly failed. Hardly a surprise as RSI showed real weakness 2:1 in the price rise off 9360. If you caught the premarket rise in ES and took to top, there was almost 30 points to be had today......
 

Attachments

  • dow 22-08-03 1 mina.gif
    dow 22-08-03 1 mina.gif
    20.6 KB · Views: 300
Who says the trend is not your friend? Picking the channel break with pin-point accuracy paid a handsome dividend. Now what? Pull back or tank?
 

Attachments

  • dow 22-08-03 10 mina.gif
    dow 22-08-03 10 mina.gif
    29.2 KB · Views: 280
Top