You are using an out of date browser. It may not display this or other websites correctly.
You should upgrade or use an alternative browser.
You should upgrade or use an alternative browser.
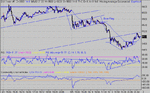
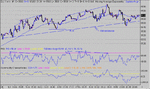
The channel resistance support lines have now been re-drawn. It's not that the revious ones were wrong- they were a best guess. Now these new lines are a 'better' guess. They are bettter because they they now form much closer parallel lines and they have the same depth as the previous trend. This emphasises that the current move is a continuation.The channel has already broken and will either continue to find support at the old resistance line. OR it will be a false breakout. Either way this line is the defining line for support.It's doubly important as the breakout was on the previous horizontal resistance and the upslope resistance line intersection at 9500.
Attachments
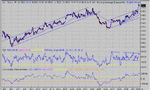
A tricky day to trade with multiple nd tops to confuse the issue. Basically a sideways day and full of potential whipsaws for the unwary.... Looking at the 2 min charts. it has the distinct look of a rolling top.... so is this another top? 9532 short 9600 long it is.
Attachments
rossored
Senior member
- Messages
- 2,103
- Likes
- 56
CM, given your comment about the tricky-ness of the day ( and I lost out, shorting on what I thought was a H&S, only to see the price bounce right off the 100MA and take out my stop....doh 🙄 ), is my analysis wrong here? I thought the flags traded pretty much to targets? The cash chart normally shows things a bit clearer, but this appears a bit clearer today (this isnt the whole day, of course)
Attachments
Last edited:
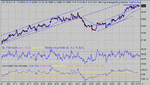
A rolling top is one of the classic DOW formations at a top. ( one of many) It resembles the shape of the top of an umbrella and you can track it on the 10 min charts and predict the drop off point where it goes into free fall or not, as the case may be. Lets's see what tonight turns up....
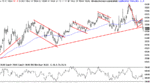
Looks like the rolling top failed at around 17:00 ish and has now turned into a triangle. This could be a nice 100 point break or drop. I favour the drop .As the horizontal resistance and up slope support meet, there's a big move in the offering as the price gets to that point. Stong buying vol on ES at the close makes me think up.....
Attachments
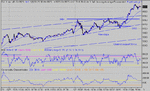
Another tricky day, being range bound by the 50 point band 9550 to 9600. Those with courage should have taken the short entry on the double top that failed to break 9600, closing at the double bottom on support. That early double bottom on uptrend support signalled a good long as well, with a close on the ND top at the first 9600 touch. This was follwed by another one. Very strange, but at least you got two shots at an out at 9600, in fact, three, in all, for those of you that are greed driven! :cheesy: A leisurely 80 - 100 odd points....
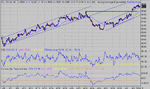
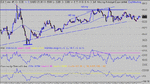
Two days of narrow range and a triangle in the offering should give us a nice range break tomorrow, and maybe something to shout about.
Two days of narrow range and a triangle in the offering should give us a nice range break tomorrow, and maybe something to shout about.
Attachments
"Those with courage should have taken the short entry on the double top that failed to break 9600"
Those who had been out (again) the night before and with very very slow brains went long ......
Ah well, at least I closed when id started heading down - lost 28 points, but went short and had enough brain cells left to close at the dbl bottom. Made up some of those points at least.
Sigh !
Those who had been out (again) the night before and with very very slow brains went long ......
Ah well, at least I closed when id started heading down - lost 28 points, but went short and had enough brain cells left to close at the dbl bottom. Made up some of those points at least.
Sigh !
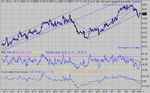
110 the drop but no chance to take it as the news came out in pre market. Still, the Bear flag offered an opportunity, with a farly slow dropout to get onboard . And note the H&S at the end of the flag... Where to get out ? divergent bottom on ES as well as dow and the Vol divergence on ES confirms. Good guess for the close for me this week, only a few points out at 9489. Makes a change.