Dow Intraday charts 01/07 05/07

ChartMan

Legendary member
Messages
5,580
Likes
47
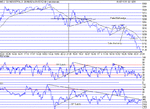
Not a lot of interesting stuff today....Early whipsaws around the 100MA caused some indescision, but settled down into the expected down trend at around 4pm... Another whipsaw session started at around 6pm with a bull wedge forming that looked as if it would perform...The divergence on RSI gave doubt...and finally it failed to confirm the down trend with a straight 100 point plus drop into the close.
 

Attachments

  • dow 01-07-02.gif
    dow 01-07-02.gif
    17.2 KB · Views: 423
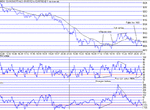
Not an overly exiting day,with quite a few whipsaws mid day and a couple later on towards the close.The relative high volatility compared to the price range made it difficult to hold under the 100MA with any conviction. Still, the100 point rise to the start of the 3 pk nd top should have paid dividends, followed by the eventual failure and drop through the 100MA. Even then it wasn't a simple ride, whith two whipsaws and an Inv. H&S that looked like it might be another bottom, but quickly went back to "as you were" after a brief excursion beyond the 100MA.
Just serves to show that this 100 MA trading strategy can bite sometimes.... as well as provide excellent rewards. Entering off the 100 bounce at 9134 and "anticipating " the bottom at 8965, reversing to the 3 pk nd top and back again would have made it a good day. Easy in hind sight.......
There looks to be a good horizontal support at 9004 ,developed across most of the day. This ties in nicely with the 10 min charts that suggests some upside. I guess we would need to recover the Fib. 23% point at 9050 before we can think seriously about more upside....
 

Attachments

  • 02-07-02.gif
    02-07-02.gif
    15.8 KB · Views: 393
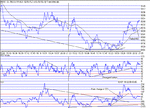
We closed on the 23% Fib. point at 9050 and that has probably saved the day, barring any untoward bad news tomorrow. Quite a good day to trade with a couple of unusual happenings that lead me to think more upside. These were the H&S formations, one at the bottom and one at the end of the day, both of which failed to perform - ie they didn't drop.I know FB , you can't get H&S's at bottoms...but the formation is there, and it has expectations.... The point is, as TA failures that suggest an up in a downtrend confirm more down, so the TA failure that suggests down, in and uptrend, confirms more up. The bottom took a long time to develop and resolve to the upside, but the early warning was there....Divergence on RSI from LOD at 8899 up yo the breakout at 19:23@ 8930. The advance warning came from the increase in the slope of CCI, quite significantly. Who says "there is no such thing as a leading indicator in TA" ?? This is a clear example.
Again the 100MA did it's job for the most part,with a couple of minor whipsaws .... but then with a couple of top reversals, due to the high rate of rise in the price, one could have maintained good position, except just prior to the breakout......

No report tomorrow- Independance Day in the US.
 

Attachments

  • 03-07-02.gif
    03-07-02.gif
    19.3 KB · Views: 350
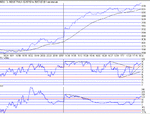
A most bizarre day. TA all went to pot as the market went mad. Even I got caught out by the huge drop in RSI that hardly moved the price at all...24 points in fact, thinking it had to be reversal time. :( All in all, not a lot one can say about a rise that was obviously due to too many Viagra tablets. :) We certainly don't get many of those to the pound.
 

Attachments

  • 05-07-02.gif
    05-07-02.gif
    12.6 KB · Views: 303
Top