The DOW this week 01/07 05/07

ChartMan

Legendary member
Messages
5,580
Likes
47
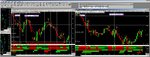
Over all , down all day as expected...Suppoprt from the 38% Fib. was lost just at the close so we can look to 23% for support at 9053. Horizontal support at 9103 may come into effect, but looks weak. Up trend TA support gone and Phase has moved below the mid channel with room for more down side.
100MA : 9227. Support: 9106,9064,9053,9000,8950. Resistance: 9132,9175,9200,9250.
 

Attachments

  • dow010702.gif
    dow010702.gif
    15.7 KB · Views: 531
So we got more downside, but as I see it, we should now move upside.....OK so the 23% went at 9053 and we fell below, but there are a couple of good signs. Phase touched on the previous down channel support and moved up to mid band. That has had the effect of producing a possible Phase up channel.The downtrend resistance line drawn last night provided a nice clean bounce at 8980, and providing a horizontal support point as well. There are now four parallel horizontal support/resistance lines at 9364,9240, 9106 and 8980, giving us the familiar three trading bands/channels. It seems logical that we will now move up these channels......unless 8980 is lost as support. So next important resistance is 9100...
100 MA :9121. Support: 8980,8950, fresh air. Resistance: 9050,9106,9170,9232.
 

Attachments

  • dow020702.gif
    dow020702.gif
    15.4 KB · Views: 516
I keep a track of daily movements on S&P 500 futures: the 10 day cumulative movement is at an all time low of -90 and we have only had 2 up days and we are at support and very very oversold.

If we do not bounce now the 5 year H&S on the S&P has its neckline at 944.. a decisive break says about 400 in the future..

Somehow I think we will have a defense first...
 
Yep, I agree MAD, and it looks like it has turned round, at least for now. Next week ? who knows.
We dipped out of the suggested channel bottom, but recovered to good effect. We have formed a nice "W" bottom and Phase is now forming a definite up channel, closing just below the mid point, leaving plenty of room for upside. 8980 has now become horizontal support and the next targt up will be res at 9108. hopefully, the 23% Fib.point at 9050 will become support too... If the "W" bottom performs we get a target of 9170, right on the upper down trend resistance line.That will be a major breaching point. Win that, and we could be looking at a substantial bottom. I don't see that being resolved by Friday, but it should give us something to look forward to next week. Either way, so long as we get volatility, we should do well.
100MA: 9040. Support: 9050,8980,8900..Resistance: 9100/08,9164,9200,9242.
 

Attachments

  • dow030702.gif
    dow030702.gif
    16 KB · Views: 442
Still oversold..per 3 end of day indicators I use.

Reckon we will have a big move Friday.. especially if no terror attacks US..

I concur. ChartMan.
 
MAD,

any chance you could put up some charts to further clarify your thoughts. It's all quite interesting.

Cheers,
 
chart attached..60 mins on left 13 on right..

The bottom 2 lines (colour markers) are ob/os indicators.. see 60 mins.. green = oversold. Note signals on 60 min charts...
 
sorry

last chart too big. hopefully here
 

Attachments

  • dow3julj.jpg
    dow3julj.jpg
    829.8 KB · Views: 444
Mad, what charting software do you use and who do you get the data feed from? Does the software automatically generate the buy and sell signals and if so are they providing good results if spreadbet?

Many thanks - Rubber.
 
Rubber
I'm using Investor RT

http://www.linnsoft.com/index.html

The software generates all signals from preprogrammed indicators generated by me.. but you can use almost any indicator you have heard of with any combination of attributes to give almost anything you want. Very flexible and powerful. You can download free to play with.

Data feed is mytrack for UK and US Silver Service..

Mike
 
and here is my End of Day chart for SPX tonight after the huge rally.

Trin closed below 0.5 and that always is a bearish sign...the red flag in the middle chart section.
The trading range is still at extreme levels.. the Purple flag.

If history repeats, Monday will see and UP move first thing followed by an NR7 day (narrow trading range - NR7 yellow flag) followed by a reversal down on Tuesday.


(and yes this is all software preprogrammed.. I don't believe in manual calcs when a program can do it for me...)

Note the green oversold indicators at the bottom have disappeared today...
 

Attachments

  • eod.jpg
    eod.jpg
    205.5 KB · Views: 477
What a day. And I said we wouldn't get this much today. Oh well, mustn't complain :) Not a lot I can say about today, except we broke through the 50% Fib point and would probably have gone further, had there been a full day.We sailed through all the resistance points, and Wednesday I obviously didn't include enough,thinking that we wouldn't go this high. Huge rise, too much too quick so one can assume that there has to be some retrace from this.On the other hand, there must be a lot of confidence over there, to get so much rise and not even a whisper of a retrace or a pullback today.
The chart is full of lines that seem to lead nowhere so we will have to wait till next week to see what happens in the way of establishing a new trend......Up , I presume, but not at this rate. Phase has risen straight to the top of the up channel indicating a pullback.
100MA: 9130. Support 9313,9216,9108. Resistance: 9400,9500,9556,9620.
 

Attachments

  • dow050702.gif
    dow050702.gif
    16.4 KB · Views: 281
Top