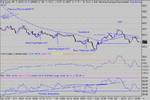
Day trading the DOW 24/03/03

ChartMan

Legendary member
Messages
5,580
Likes
47
News over the weekend had a big effect on prices, opening down big time. No reason to do anything other than go with the flow. Short entry could have been anywhere..... Multiple targets on the Bear Flag pullbacks started with a nominal first target of 8173- followed broadly by ever decreasing targets. A clue to where to find the bottom.... Pullbacks getting ever closer to the 100MA is another clue...
Finally a bottom break and a long opportunity at 8230 with hopefully 100+ in the bag from the short. The breakout was short lived developing into an H&S that delivered, the sensible option getting out for about break even as it bounced back up off 100MA -20 @8210.
Note the pos. divergence failed to deliver- a sign of weakness.
I know you shouln't play the news, but all the while the reports show nothing positive , there will be negative sentiment and no heart to push prices up leaving very liitle choice.
Not a time to be guessing bottoms and going long. Even if a set-up presesnts itself like it did towards the close tonight, I suggest you give it bit more room , just to be sure the market really wants up. That cost me -30. I went long on the resistance break at the second try at 8240 and bailed out after it dropped back through.:(
NOTE! tonight's chart is at 2 min and 50 EMA to get most of today's action.
 

Attachments

  • dow 24-03-03 1 mina.gif
    dow 24-03-03 1 mina.gif
    18.2 KB · Views: 898
Not too good a day today, safety being the name of the game. I considered a long due to the overcooked drop yesterday and no real further bad news.... I decided that I would have to abandon normal entries and look for a clear break of resistance above the 100MA ( 8240 marked). The top caught me out, ignoring the slim negative divergence in RSI and long term down trend in CCI. :( I have to put my hands up to thinking there was more in the move because of the mainly positive news during the day..... Bad Bad mistake!!! But then I'm only human. 160 odd points on offer turned into only 60 in the end. I did take a gamble in the final session at the triangle breakout and squeezed some bonus points, having gambled on the PD bottom coming good after such a big drop. Not an easy day.
The failed bull flag was pretty obvious in hind sight with RSI failing to match the higher high. So obvious I could kick myself....
 

Attachments

  • dow 25-03-03 1 mina.gif
    dow 25-03-03 1 mina.gif
    21.5 KB · Views: 843
Quick chart tonight...... mostly commented. Great examples of SR and RS switches, enabling early entries. Messy end to the day.Was looking for an 8300 close.... then the triangle failed. Notice here the balance of power was below the 100MA around 8255.The previous triangle at 19:55 break had all the form above the 100MA. Note the correlation of the failed triangle to the SR switch in RSI.
 

Attachments

  • dow 26-03-03 1 mina.gif
    dow 26-03-03 1 mina.gif
    25.6 KB · Views: 799
Here's a nice reverse triangle building up..... Target 885 on the breakout. Does this look familiar in any way? Why would I be interested in it if it was? :cheesy:
 

Attachments

  • es reverse triange setup.gif
    es reverse triange setup.gif
    24.9 KB · Views: 805
Chartman,

thanks for the charts & info. A couple of questions if I may,

Looking at todays dji, the 1st 3 short entries are after breaking back down thru the 100ma. Why wouldn't you wait for a break of the low at 8220?

Then the 4 longs from 16.40 - 17.00. This is inside the 100ma + 20, so why do you go long just then?

many thanks

o
 
1: because you don't know if the move is going to resolve into a bigger slide..... by going short, we hope it is. The primary system here is trading an algorithm based on the movement of the prive v the 100MA.
The 4 longs have an over riding TA entry- the RS switch. Other wise, wait for the pullback above the 100MA. The price doesn't have to break beyond the 100MA+20 to be a valid long entry, just a pullback towards the 100MA- the closer the better and the more the better, as in this case.
 
Chartman

thanks for this excellent source of information. In Sierra chart do you have your EMA calculated on the close price?
 
Chartman,

just to say thanks once again.

I'm reading the charts so much better now. Had a reasonable day on the dow. Could have been really good if I'd followed the rules properly, but I'm just pleased that I'm recongnising some of the signals on the charts.

o.
 
Martin

Is there any reason why your thread requires me to scroll sideways to read the post and part is missed on printing?

I recall, many moons ago there was a similiar query, and I know there must be an answer

John
 
TyKoon, yes the EMA is on the close.
OlwenH- glad you're having fun and have benefited .Takes time to get regimented ........
Uncle- you may ind increasing your screen resolution to 1000x 768 will fix it. If you are still on a 15" monitor, you may be out of luck. AS for printing, I don't know...... Sharky might.....
 
Chartman,

Any chance you could show us your moves on the Dow today?

Thanks,

Regards,

Bob.
 
A good day overall with a sting in the tail, increasing gains - if you were sharp enough..... The short entry at the open was a familiar "wherever you fancy" entry. Not very scientific is it? Maybe there is a case for handling some sort of contingency for locking in profit with a trailing stop. I've never been keen on this, or felt the need..... If anything , there was an Inverse H&S at the bottom that deleivered it's target at 8135. From there a triangle developed, biased to the dropside. That triangle target was 8175 and an 8175 break signalled my long entry. Going back to the bottom, RSI showed continuous divergence from the open, but I've found that that can be misleading and unreliable.
Interestingly, RSI showed a number of RS switches as we went up the channel, providing support at 40 on every dip -a BIG clue.
The "end" started at 17:40 - Negative divergence. Of course, at that time an unknown. BUT by 18:00 we got the second peak across 20 minutes. We need at least 12-15 mins to be a valid signal. Take a bonus point if you saw that....The third peak didn't occur until 19:23.... By that time you should have worked out the Bull flag target of 8250 ( I got it spot on) and tracked the price all the way up to the top. IF you were in touch, that would have been your exit...... IF not, we then had another bull flag develop, bracing the 100MA This breached the 100MA by 12 points max....
So you got gready and held....... Well I hope you saw the failure of the bull flag! AND the failure to make a new high AND the BIG tick down!! This was your reversal signal and LAST chance!
The clues were all there and you should have seen the warning signs. This situation is difficult to handle iF you miss it because you instantly become the "rabbit in the headlights". Fear sets in, panick and a total reluctance to close , in the hope it will turn around. :(
IF all else failed, the final final clue was the loss if 40 RSI support in just 2 ticks movement.That had held all day. Strong support break = BIG move.
I would expect the major bear flag to deliver tomorrow, but no guessing allowed. :) Closing near the 100MA makes for uncertainty anyway. Wait and see.Trade the chart, not the news or your hopes, wishes and guesses.

******* chart text error****** the final bull flag target should have read 8280 NOT 8180 SORRY. ( pasted in now)
 

Attachments

  • dow 27-03-03 1 mina.gif
    dow 27-03-03 1 mina.gif
    24.5 KB · Views: 555
Chartman,

Thanks for tonights post.
I have just awarded myself a score of 1 / 10.

Bob. :eek:
 
Looking at a longer term 3 min chart, you can see today has formed a possible bull flag with 8350 as a target. So, if 8250 goes tomorrow, you'll know where your target is.... IF it turns out to be a bear flag, sub 8100 is the target. That's the likely move if 8180 is lost as support.
 

Attachments

  • dow 27-03-03 3 minb.gif
    dow 27-03-03 3 minb.gif
    23 KB · Views: 678
A follow up to the reverse triangle posted yesterday. The target has failed to deliver- falling short by 2 points. Enough to call it a failure, confirmed by the following recovery to 872. Still leaves us stuck in no man's land, but on the balance I'd say up because the flag has failed to deliver the target. That STILL doesn't mean you can go blindly long tomorrow :) It does show that 865/866 is rediscovered support..... I will take that as my cue.
 

Attachments

  • es failed rev triangle.gif
    es failed rev triangle.gif
    26.7 KB · Views: 668
Chartman, I enquired about the EMA being calculated on the close as I was wondering if there was any reason that on both Medved Quote Tracker and Prophit Finance Java Charts the 100 EMA appears slightly differently to your Sierra version. Yours appears to be closer to the price. Is there any reason for this? It appears the same on those 2 programs.

Thanks :)
 
Chartman - superb work. Am studying hard ! Looking forward to today. I agree with tykoon about the 100EMA. I'm trialing esignal this week and your 100EMA does appear 'higher' at times. Possible that you're using more historical data in your calculation ? Mine only goes back two weeks. Would this affect it ?
Really value this thread...
Jesse.
 
Using Bigcharts, I found the 60ema matches Chartman's 100ema after the first hour. Using Lycos, I found the 60ema off 4 matches Chartman's 100ema after the first hour. These charts don't use the futures price so the ema looks different in the first hour.
 
at the risk of offending chartman, (I hope not), but he changed his charts to 2min & 50 ema earlier in the week. I think he may have forgotten to change it back to 100 when he went back to the 1 min charts.
 
Top