Day trading the DOW 21/04/03

ChartMan

Legendary member
Messages
5,580
Likes
47
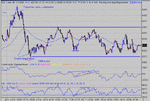
Nice flat day today. Just a short report as I've been out all day and I'm crackered :)
A reasonable start to the day with the 8395 top just making target and forming an H&S. The pullback at 8350 made target but the next one didn't.The double target failure refers to the pullbacks at 8333 and 8314. Off the 8300 test we had an Inv. H&S that delivered target 8339 followed by a pullback towards the 100MA, - a reasonable long entry. From there the going looked really tough. Just one clue as far as I can see and that was the triangle build up in CCI and RSI that finally broke to the downside at 18:53.If you came out on top today, take a pat on the back.The early gains off the highs may have just been enough to cover later potential losses....... Not a nice day to trade at all , by the looks.
 

Attachments

  • dow 21-04-03 1 mina.gif
    dow 21-04-03 1 mina.gif
    24.9 KB · Views: 827
Thanks ChartMan,

I wasn’t planning to trade today being Bank Holiday, but decided to watch the US open – that sharp early rise could only mean one thing (T/A or no T/A) – an irresistable short at 10amET!!

So short I did, and ½ hour later was 75 points better off and ready to call it a ‘day’ (it made for a good ‘Bank’ holiday!!)

Regards, TradeSmart
 
Tradesmart,

same logic - I did the same. Actually I stayed a bit longer, went long at 8342 at the push above 100 MA - no energy in that push though, closed at 8352. About 60 points up in the aerly going + 10 pathetic points later on.

Lads I know you do not look too much at "macro" indicators like front-end implied vols (VIX index) but if we don't go up in the next few days and VIX carries on staying below 25 - expect a STEEP decline. My experience: any time VIX is below 25 u can safely short spooz (or Dow of coz) or buy cartloads of puts. The latter is double-shot: u make money on the directional move down + vols spike up and you don't lose on moving along the skew as mrkt goes down.

cheers
 
Now here's a nice day! Just take a look back at yesterday's chart.8360 and 8320 was the trading channel width. That should have played a part in your decision making today.
First trade came as the mess of the first half hour + decided where it wanted to go. I trust nobody "guessed"during this period. At the very least, you should have been watching RSI and CCI rise off their ultra lows. Slowly but surely, we got a break of the price resistance trendline and soon broke the 100MA with an immediate pullback. Long entry here. The only target from here was 8320 - not a lot, but back to yesterday's old support.An important line in the sand. Through that and on more... until the first real pullback giving a target (from 8300 base) at 8384...
Now. 2 things. As this move progressed, we can see Neg. Divergence setting in. Secondly, yesterday's 8360 resistance went at the second attempt, BUT no pullback to re-test. So at 15:50 we get our 3 peak ND top BUT it's only across 20 minutes. ( remember the rule- a divergent top/bottom has to be across > 25 mins). What to do? Ticky one. There's 80 points on the table. I had decided, by now, today could be a big move day based on yesterday's consolidation.So I was not too interested in closing and going short. Had the divergence been across 30 mins+ then I may have done. So I waited. Until the 8360 was tested and failed and closed at that point for +8.( In at 890 out at 898).
In the chat room I was asked when's the next long entry, to which I replied - on the 8360 break again- a key value.
As it turned out, holding as per the 100MA plan would have held good anyway, but you never know what's just round the corner....
You have to balance up the information in front of you...ND top? Big up day? hold to the 100MA? Key level failed?
So after that lot it was watch for a break of 8360 again, and so it did. IF you did reverse at the top, you should have got your exit off the short PD bottom just below the 100MA... A short PD bottom ( or top) is a short term reversal signal, not a major trend reversal....
So the entry came and was followed by a pullback to re-test 8360 for support- feeling much more comfortable after that. It looked like the first target up (8417) was going to fail but we just had a pullback to test 8400 ( prior resistance- check your 10 min chart!)
At target, there was another push up to 8440 yet another past resistance line..... If this was a pullback the target was now 8460- duly met. Next target up 8502....
Well, we didn't make it. Today. And this time we had ND from 19:17 to 20:30. Time to close around 8480 for 120 odd points.....
Nice steady rise today and no reason for it not to continue tomorrow. Keep in mind key support values of 8440 and 8400 tomorrow.... I see the target for the current move on 10 min chart as 8550, with 8500 as key resistance and 8620 as the top end of possibilities. :cheesy:
 

Attachments

  • dow 22-04-03 1 mina.gif
    dow 22-04-03 1 mina.gif
    18.7 KB · Views: 741
Triangle developing on Dow, perfect for the 4th wave, we all know what that means, a rise the same size of wave 1, 3 was extended, and then goodbye vienna. Super.
 
I'll just quickly post this, as the last time one showed up was way,way back..... A Diamond formation across 2 days. A gem :)
 

Attachments

  • diamond.gif
    diamond.gif
    19.1 KB · Views: 602
Great day with lots of swings and opportunities . First up the ND top that rolled over from yesterday, thanks to a flat open and yesterdays resistance of 8505. Short that and cover at the support test 8450 with short term PD. Long to the double top and short back to support. Easy :(
And so we saw a triangle develop, to break at 8480, eventually. Next long. Target was 8524 based on the mouth of 45 points.Why not take the mouth from 8505 I hear you say? Answer, because that's NOT where the triangle starts to develop. It would have needed to "flat bottom " across 8470 for that to be valid so the break down through that negated 8505 as the high. This is where the diamond came into play. Get this wrong and your target is a mile off.As it happened, it didn't matter, as there was no follow through from the target.Picking other targets on the way to 8525 was a real mess although a few of us in the chat room arrived at 8525 by different means, adding certainty.Only good guesswork would have got you aot at the top here as there were no other signs.....
Good flag in the middle of the drop testing 8500 and so producing a target of 8470.
Then we had a PD bottom across 34 mins, calling a firm bottom :)
Two possible safe entries here for the long. First up was the break of the lower bull flag at 8480 ish. Second was the pullback just above the 100MA at 8490. Not a lot on offer from this move, time running out and testing 8525 for a second time.
Another bit of a messy day, but nice rewards for those with the patience to wait for things to break out.... 100- 200 points on offer depending on your preferences and skills. I missed the biggest move of the day. I chose to close my long over tea time as opposed to leaving in a stop that I felt would get hit with volatility so I banked. Wrong decision. Right at the time. Next wrong move was taking the break at just after 7pm and having to sit out double a re -test of 8470. Came good in the end but had to wait the rest of the evening.
8500 and 8470 key support tomorrow, with Res set at 8525.
 

Attachments

  • dow 23-04-03 1 mina.gif
    dow 23-04-03 1 mina.gif
    26.7 KB · Views: 608
Chartman thanks. You described and annotated the chart brilliantly.

I was not trading yesterday so did not watch it develop, however, I'm sure, that as normal, it all looks a lot easier in hindsight than at the time.

Dino.
 
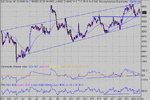
Time to reflect on the whole picture again....... The up channel is 230-270 odd points wide. There has been a slope change in the price.Two triangle- one on RSI,the other on CCI.CCI has broken to form a possible RS Switch. RSI is in a critical state.Inv H&S target 8480. 8400 good support and tested well today. The next few days will be interesting. Up or Fail?
 

Attachments

  • dow 10 min 24-04-03.gif
    dow 10 min 24-04-03.gif
    30.3 KB · Views: 534
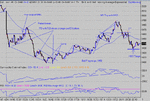
Bit of a this n that today. Overnight futures brought the gap down on open. The hard part was finding an entry,one way or the other. The open developed a bull triangle that broke.. a possible entry BUT waiting for the pullback would have saved you a failed long. It was only 10 points away from the 100MA... Given the prior 8460 RS line, this was an important attempt. The drop down through 8460 SHOULD have been your short entry signal. Failed breakout and failed support test..... It wasn't long before we were calling PD bottoms in the chat room, but I think some jumped the gun, only to be faced with a re-test of 8400. The first test made a confirmed 3 peak ND bottom, but there was a biut more left. One could have been fogiven for going long on the 3rd. low. Perfectly correct decision. Just be aware that opening ND bottoms often go the extra step into 4 peaks. That said, max deviation was only 10 points or so ( so long as you ignored BIAS!!). A classic example of taking your cue from the chart and not the SB price. I wouldn't be surprised if their price on that final downtick hit 8380 to sell.
So now we're long and looking for a target. First up a tiny H&S. Not interested.But we are interested in the fact that the price is heading south threatening our trade. You should have uptrend support lines drawn on RSI and CCI. Here is your cue- the RSI and CCI support bounce off 8407 confirming an up trend.
We get out target eventually from the bull flag- a 20 point drop from it's high. IF you spot these early enough, you can get a rough idea of the size of the flag and guestimate the likely third low. 8450 was the target and it just got made.Then there was a strange looking appology for a bull flag, only reecognisable after the event. You could have been fogiven here for closing- 8460 retest fail again..... and some ND. A clue as to why not, MAYBE, the price was 25 up on the 100MA, usually a margin of strength....
Either way, there was another entry as 8460 finally went, after deliberation. That left ony 30 points max, but you didn't know that at the time, so you take it. IF you read that funny bull flag as such, you should have got a target of 8482 or so.
At any rate, we ended the move with a 3 pk ND top and a double top tacked on the end of that, so a double exit signal.
So now short. We get a H&S top with a target of 8430. Good struggle around 8460 yet again, with a small failed bull flag here, just under the 100MA. Nice confirmation of more to come and covering off the target bottom. 100- 150 points on offer today.
Couple of final points. Note the everlasting CCI uptrend support line... It is important to recognise a change in the slope of RSI. This often signals an early breakout as it did off the PD bottom today. You can see it off tops too....
 

Attachments

  • dow 24-04-03 1 mina.gif
    dow 24-04-03 1 mina.gif
    23.1 KB · Views: 454
Chartman, your commentary is excellent as usual, thank you very much for posting these they are most enlightening.

For information, I have just check the D4F prices around the time of that bottom. The bid hit 8390 on the final (4th) leg down, the previous low was actually lower at 8388 on the third leg down. In comparison the DJ futures hit a low of 8370 on both occasions.

The cash index hit lows of 8395 (4th) and 9398 (3rd).

So in conclusion you should have been alright trading this with D4F as the forth low didn't go lower than the third low at all (unlike the index), it just tracked the futures. Is this a case of the "bias" actually working in our favour?

Seriously, can we use this information to our advantage? There is actually (very slight) PD between the cash index and the futures/D4F prices at that point, leading to the subsequent rise in the index.
 
I have said in a previous post, that I found it very useful to chart the dow cash on D4F as it automatically included their "bias". As you rightly say, this was an occaision that would have been to your advantage.... There was a time when one could take the D4F chart and price and use it to trade Fins, who where a few seconds behind with their algorithm. This enabled me to scalp very successfully!!! Sadly that got quickly sorted and is no longer true...
It may be the case that they use a combination of DOW, ES and NQ futures to "compute" their prices... hence the anomaly at the bottom.We'll never know.:(
 
Chartman -u right they do, I know it for a fact. In usual circumstances when NQ outpaces the blue chips at the extremes, they actually place their bias on the "wildest" wing.
 
Boring, but profitable day. Take your choice on an entry for a short and walk away. Probably the easiest stress free 100+points you'll ever get..... No divergence, No H&S's, No triangles, NOTHING. Yawn yawn.
Highlight of the day may have been a long entry at around 16:30 ( reasonable decision) that very quickly failed.
Now I'll tell you why that was a BAD move!
Remember I spoke a while ago about guaging strength of moves by the RSI/Price ratio. Take the previous bear flag- 16:30 - 17:20. RSI moved up from 25-70- 45 points. Price moved 24. 1:2
The down move was similarly pathetic, if not swift.- 30:52
With numbers as weak as that , the price was going NOWHERE, fast. All the strong moves were in the initial drop to 8300.
More bear flags meeting target than I've had hot dinners.
Check the 10 Min chart. We've now dropped out of the up trending channel and it looks to be a perfect support /resistance switch.
 

Attachments

  • dow 25-04-03 1 mina.gif
    dow 25-04-03 1 mina.gif
    21.5 KB · Views: 277
Top