Cotton

PeterTT said:
I am not really a day trader .. just look for nice explosive chart patterns that I think will run for 1 week to 4 weeks time frame. Cotton over last 2 weeks has been my sort of trade.

Peter

Hi Peter,

Are you talking about consolidation or trading range breakouts ?
 
Neil .. I am more contrarian in my take. I look more at dramatic turns in trends .. cotton has been a fine example of this .. everyones been buying and is long , every "analyst" says its going up, BUT the chart says no !

Peter

Peter
 
PeterTT said:
Neil .. I am more contrarian in my take. I look more at dramatic turns in trends .. cotton has been a fine example of this .. everyones been buying and is long , every "analyst" says its going up, BUT the chart says no !

Peter

Peter


Looking at the chart I see what you mean
 
March Cotton

Neill, PeterTT,
I would agree on reversal of uptrend but I think continuation of downtrend is not yet a foregone conclusion. Chart shows that rising window has been filled, next support at 70.75 low of bullis engulfing pattern dd 10 Oct. Below that the gaps in mid-60's. Momentum indicators are all down. Please also note that open interest is dropping slightly. So recent slide is probably caused by closing of longs. Have bears taken control or is currrent move caused by just retreat of longs??

As CT remains down, trend followers will certainly get more involved on the shortside.
I am short but in all fairness still in doubt about where to put my buy stop.
Any thoughts?
 
Last edited:
March Cotton

well, something went wrong!! :eek:
Glad it wasn't a bank statement!!! :LOL:
Here's another attempt to attach the cotton chart
 

Attachments

  • cotton.png
    cotton.png
    155 KB · Views: 295
I am out now (just due to way my spreadbetting account stops quoting dec03 on last Friday). However, if I was still short I would wait until there was a clear upward dymanic on the chart before cutting .. so in effect it would have to be a limit up day (USD 3), or maybe a failed downward dynamic (ie goes alot lower but closes flat/up on the day)
Looking at the chart for March there is no clear support until 70.00
 
Another limit down day (at least till now). Have covered 1/2 position at yesterdays' low and put in stop on remaining position at 67.70. Reasoning: lack of understanding of dynamics in this market!
China story is clear but understand that funds are liquidiating! For how long? We are near enough (for my liking) to the 6200-6700 rsing windows near the kicked off of recent bull market.

Any wisdom out there on this situation?
 
Hi BGold

I would just be watchful of the 6500 gap level, but apart from that it looks fine to me :)

Out of interest what is a limit up or limit down day. I have heard them mentioned in the past, but can't remember the details :eek:


BTW If you did accidentally post your bank statement above, then you can always go in and edit your own post. Click on the edit button on the bottom-right of your post and edit things from there. It's got me out of a few interesting posts in the past ;)
 
Limit Up/ Down are gates at which prices cannot exceed for the day - stops crashing/ rocketing prices at certain levels.

May have been introduced due to buy/sell panics induced by programme trading?

Others might have a better explanation.
 
FTSE beater, thank you for editing tip.
Neil is right on limit up/down description. They are introduced essentially to cool down the market. In equities markets, various Exchanges stop trading for a certain time (always in crash scenario's) but in "real" product markets they ensure that temporary shortages, news etc will not disrupt the real economic process and are triggered quite often, both up and down. See for examples the meats, LC, PB and CT. Orange Juice is also notorious.

Intesrting note is that where in equyities panics usually bootoms are, in commodities markets the panics often coincide with tops as panic is caused in believe that there is a scarcity!
 
Limits were originally used to allow time for the Clearing House to make margin calls in fast moving markets.
 
Interesting to learn; makes a lot of sense considering the high leverage. thanks
 
Bottoming?

March cotton tested the bottom of 25Nov and bounced off the bullish engulfing pattern of 29Sep.

Yesterdays' bounce was probably induced by public hugging between Bush and Chinese Premier (i haven' read reports). Chart pattern does look appealing.

$3 per contract risk is a bit much for rushing into a long position.

Let's follow this one closely.

Any other views/observations most welcome?
 

Attachments

  • cotton.png
    cotton.png
    92.3 KB · Views: 276
Last edited:
bgold -

I find using MACD + SLOW STOCHASTIC in combination gives some pretty reliable signals.

If you look at my chart for MAR04 Cotton, good historical signals have been generated when three factors co-incide :

BUY when 1) SLOW STOCH moves from below 20 to above
AND 2) MACD DIFF crosses above 0 line (histogram)
AND 3) MACD OSC (blue) crosses above EMA (red line)


SELL when 1) SLOW STOCH moves from above 80 to below
AND 2) MACD DIFF crosses below 0 line (histogram)
AND 3) MACD OSC (blue) crosses belowEMA (red line)


Therefore my buy signal on MAR04 cotton has not been triggered yet.
 

Attachments

  • cotton.png
    cotton.png
    39.1 KB · Views: 290
DaveT,
Thank you for sharing this methodology. The system looks very convincing in Cotton and no doubt works really well in volatile markets (eg big swings).

- Have you tested it on other commodities or financial futures?
- Are you always either long or short? Can and how do you determine to ignore signal (eg stay flat if market is going nowhere)?
- I would be interested how you scan your trading stable and what software you would recommend. I use eSignal, charts and data feeds are good but I find tailoring formula's and programming scans a challenge.


Much appreciated feedback. I am afraid the commodities Board on T2W doesnot see many visitors, let alone active participants posting views and comments.
 
Beg my ignorance but 2) and 3) are one and the same thing...

Even better it reduces simply to MACD historgram (i.e MACD Difference) going above or below 0 in the example given.

The Stochastics are therefor surplus to requirements...

Care to comment?

Thanks

JonnyT

JonnyT
 
JonnyT,
See u r online.
I interptretted DaveT factor 3) as in case of a SELL the MACD line (blue) has to cross MACDsignal from above (down which is factor 2) while being positive.
DaveT, please correct if I am mistaken
 
Correct bgold -

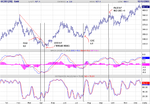
MACD (blue) must cross EMA (red) FROM ABOVE whilst positive for a SELL

MACD (blue) must cross EMA (red) FROM BELOW whilst negative
for a BUY.

To answer some of your questions -

JonnyT - In reducing the method to MACD DIFF (histogram) crossing above and below 0 you will undoubtably generate many more false signals.

Using Slow Stochastic rule gives further confirmation of signal by indicating Overbought /Oversold conditons.

The more confirmation, the greater the probability of a good trade signal leading to a SIGNIFICANT MOVE.


Bgold -

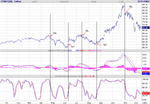
I have back-tested the method on other markets. (See Gold chart attatched). The Method is certainly not perfect (No one method ever is), so if I find a market that has regularly given good signals using this method I will trade accordingly.

If possible , I always look for confirmation in the PRICE ACTION - -ie trendline break, pattern completion, reversal day ,etc.
Remember the method uses 2 momentum indicators - you buy and sell PRICE , NOT MOMENTUM.

I use a SB company to trade, using their charting software for stocks, and FutureSource for other markets - comms, bonds,etc.

As a position trader, I always look at the longer-term charts first, and I do follow fundamentals as the general background.

I am quite happy to remain flat for days or weeks (as now). Iview FLAT as a position.


I have attached the DEC03 GOLD chart using the same method.

The first signal was clearly FALSE, which underlines my point about seeking PRICE PATTERN/TRENDLINE etc confirmation.

The last highlighted signal shows why JonnyT's idea of just using MACD DIFF would be insufficient - MACD lines were above 0 when crossing AND Slow Stoch was approaching 80 (Overbought).

I hope this clarifies.
 

Attachments

  • gold.png
    gold.png
    41.4 KB · Views: 304
Haven't you missed off a few bad short trades?

One in September, October, November and December?

JonnyT
 
Top