Ok. Jonny, but I also trade using common sense.
I would never SHORT into a rising market until/unless a FIRM TOP was indicated BY PRICE.
These systems will never work unless you take certain basic principles as read. (red?)
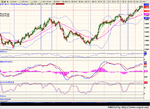
PS - I do not see SELL signals (as exactly prescribed by the method) in OCT, NOV or DEC. Remember all 3 conditions must occut AT THE SAME TIME , joined by the vertical line drwn.
It is not meant to be a mechanical system, merely a method to enhance trading signals.
I would never SHORT into a rising market until/unless a FIRM TOP was indicated BY PRICE.
These systems will never work unless you take certain basic principles as read. (red?)
PS - I do not see SELL signals (as exactly prescribed by the method) in OCT, NOV or DEC. Remember all 3 conditions must occut AT THE SAME TIME , joined by the vertical line drwn.
It is not meant to be a mechanical system, merely a method to enhance trading signals.
Last edited: