Constantino
Junior member
- Messages
- 24
- Likes
- 20
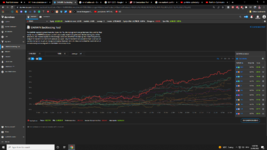
This is my portfolio's backtested performance:

Now I am looking to optimize it by applying MPT on it to appropriately weigh each Darwin. Does Darwinex provide us with automatic calculation of portfolio standard deviation, average returns, correlation, optimal weighing etc to save ourselves time?
Now I am looking to optimize it by applying MPT on it to appropriately weigh each Darwin. Does Darwinex provide us with automatic calculation of portfolio standard deviation, average returns, correlation, optimal weighing etc to save ourselves time?