• Welcome to the Darwinex Forums, these forums are member-run and managed by CavaliereVerde. Member-run forum rules may differ from the site guidelines.

Constantinos Portfolio

Constantino

Junior member
Messages
24
Likes
20
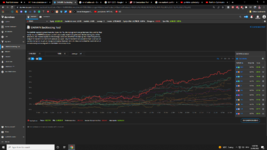
This is my portfolio's backtested performance:

1657381489475.png


Now I am looking to optimize it by applying MPT on it to appropriately weigh each Darwin. Does Darwinex provide us with automatic calculation of portfolio standard deviation, average returns, correlation, optimal weighing etc to save ourselves time?
 
I have made a list of the monthly performance of each of the darwins and their standard deviation with average return and correlations. I follow Martyn's guidance step by step to optimally weight each Darwin. Now the challenge is to generate a list of all possible weighning combinations of increments of 5% all the way up to 100% just like in his videos. However the combinations are in the millions. Should I contact an investment firm to do that for us or someone from fiverr/freelance/upwork or how?#


1657453244251.png


1657453303898.png
 
This is my portfolio's backtested performance:

View attachment 319879

Now I am looking to optimize it by applying MPT on it to appropriately weigh each Darwin. Does Darwinex provide us with automatic calculation of portfolio standard deviation, average returns, correlation, optimal weighing etc to save ourselves time?
I don't believe in these backtests as they usually show only the survivors of the current selection at the end of the today.

If you know how to use and integrate the API you can get all the data shown on the Darwin, additional calculations are up to you.

With the API you should be able to derive historical data (1 month, 6 months, 1 year, 2 years ago) for a historical selection (including the losers and the cancelled Darwins) and then you can calculate the the history of your selection.
Meanwhile I lost the motivation for that workload as I'm not accustomed to use APIs for programming or Excel.
 
Last edited:
Here I copy response from Martyn: In order to do this it would be necessary to download the DARWIN's historical quote data, and then load this into a spreadsheet. After this point the process would be identical to what I show in the videos.
The only way that I am aware of downloading the data for a DARWIN is programmatically via the Darwin API.


The point is the use of the Darwin API requires of algorithmic knowledge.

For detailed API documentation, example API calls and further information, please visit https://api.darwinex.com/store.


Do you guys know how to do that?
 
You can use different cool math theories to combine many return charts and produce a supersmooth curve.
Doing that you assume that return is due to edge while often is due to luck.
Darwins likely to have an edge are very few.
I am investing since 2016, at the beginning I was investing 20-40 darwins, now I am investing 5 and I am making money.
In my demo I have only 3 darwins and it is peforming even better.
Uncorrelated luck is not useful, I prefer correlated edge.
 
Last edited:
Here I copy response from Martyn: In order to do this it would be necessary to download the DARWIN's historical quote data, and then load this into a spreadsheet. After this point the process would be identical to what I show in the videos.
The only way that I am aware of downloading the data for a DARWIN is programmatically via the Darwin API.


The point is the use of the Darwin API requires of algorithmic knowledge.

For detailed API documentation, example API calls and further information, please visit https://api.darwinex.com/store.


Do you guys know how to do that?
I assume you better contact Darwinex support to get help.

In the beginning they showed me an import to Excel but it did not run on my machine, I assume there were security key problems which are solved meanwhile.

There are some nice funktions possible if you use the programming language R.
Maybe they have some examples.
 
What do you mean with correlated edge rather than uncorrelated luck? Who are your 5 darwins and why?

Also, I assume that the longer the Darwin has been around, the more likely is that they have an edge rather than luck. What do you think?
 
What do you mean with correlated edge rather than uncorrelated luck? Who are your 5 darwins and why?
The problem is that past return is often not predictive, so edge is the bottom line not uncorrelation.
I have a custom filter that returns me ~12 darwins , than I make an analysis on the underlying trader.

Also, I assume that the longer the Darwin has been around, the more likely is that they have an edge rather than luck. What do you think?
Long trackrecord is the main requirement but it is not a guarantee, look to LVS , PGH , LZL and many others.
 
Hey guys, just made my first investment on 10 Darwins.

I went with the Wisdom Of The Crowd principle and picked the top 10 ones with most investors following them as inspired by how all these bookmakers and bet exchanges decide their event prices.

Here is the relevant experiment about The Wisdom of the Crowd ran by the BBC

1659701456790.png
 
Wow! That's an original approach.
It is very counter-intuitive, but in statistics is normal to face counter-intuitive facts.

I have been thinking a little on this theory and who knows: Maybe you are right. You have statistical base enough; only THA has more than 700 investors, so there is base enough of investors - I assume that you only look at the investors number, not the amount invested.
The Darwins invested are the top ones, all of them really good.

On the other side in trading most of the people lose money. So, could we say that the Crowd gets wrong when it tryes to invest?

Funny experiment. Please, keep us posted :)
 
Thanks. yes, only the number of investors not the amount invested.

I forgot to mention that I also keep in mind Ray Dalio's Holy Grail.

In combination with the Wisdom of the crowd, the result is the above picks. I wanna have 15 in total, next month i will buy 5 more darwins.
 
I've watched the Ray Dalio video. Nice! It is one of the best simplest ways to highlight diversification.
Be careful though on how you measure correlation between Darwins. You should choose the right period otherwise you'd get very different values so lead you to false conclusions. That's a measure can fool us if not used properly
 
Be careful though on how you measure correlation between Darwins.

Has anyone considered using a statistical approach on this using the coefficient of correlation?
 
Has anyone considered using a statistical approach on this using the coefficient of correlation?
do you mean the von Markovik approach? if so then yes me and I failed because all the instructions I have found on the net showcase the example of taking into account the covariance of asset streams, however, Darwinex provides the correlation form instead of covariance between the darwins. Looking to hire a freelancer to do this for me
 
Here is the demo version of my strategy on 3x leverage instead

1661337936374.png


And the backtest results of current Darwins since 1 year ago

1661338218819.png


A sweet 62% return on 4x with less than 9% Maximum Drawdown
 

Attachments

  • 1661338194108.png
    1661338194108.png
    341.8 KB · Views: 61
You can use different cool math theories to combine many return charts and produce a supersmooth curve.
Doing that you assume that return is due to edge while often is due to luck.
Darwins likely to have an edge are very few.
I am investing since 2016, at the beginning I was investing 20-40 darwins, now I am investing 5 and I am making money.
In my demo I have only 3 darwins and it is peforming even better.
Uncorrelated luck is not useful, I prefer correlated edge.
how do you eventually know that a darwin is due to edge and not to luck? Like after 18 months of trading performance? Some Darwin in-house provided stat like the D-Score? Or how?
 
I have a custom filter with more than 10 rules.
Yes I am using "in house stats" = investable attibutes
Only 5 because I trust only them, it depends on additional info about the trader that is beyond numbers.
Honesty, transparency and education.
 
Last edited:
Top