The Dutch Clown
Established member
- Messages
- 592
- Likes
- 11
This weeks update is in the Queens English as a courtesy to the “few” non Dutch readers on this forum.
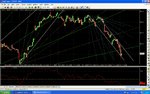
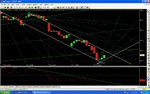
The weekly update has a top down approach and therefore begins with a long term overview starting with the Elliott Wave Analysis using a data feed of over 30 years EOD data having a closer look at the last (current) wave up from 217,80 in march 2003. For the last months we are looking at the preferred wave pattern called TripleZigZagC with a third wave (Y) on 478,44 (April top) and a fourth wave (X) on 409,56 (June low) leaving us today in the fifth wave up. I have to express serious doubt about this scenario not so much of influence for the short\medium term roadmap but a little bit further down the road. In all honestly I have to admit that it is not so much the Elliott Wave Analysis that provides me with these thoughts but the other used techniques. To complete the Elliott Wave long term picture the route is up only not as much as the current preferred wave count might indicate, I am looking for a wave Y that is being place a bit higher. Wave Y has met its first target at 455,86 and after setting a high at 478,44 took quite a dive to 409,56. The next target for wave Y is 516,32 and remember this second target because this level is coming from other techniques as well. (my first postings at this forum)
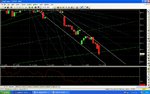
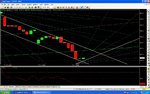
Let’s have a closer look at the sub-wave (of the above wave five) we find a first wave 409,56-444,38 and note that 444 is the 50% retracement level of 478,44-409,56 which according to Mr. Gann his findings is by far the most important level and last day’s movement showed him right again let us focus next on the 426 level which is the 50% level of 409,56-444,38 and will play its roll the next couple of day’s. From an Elliott wave point of view a second wave to the above mentioned first and if we look at the time relationship it becomes clear that the second wave should not run much longer because on the 20th it is as long as the first wave and that is not typical for a second wave. To complete the whole picture here, Yes Sir it might result in a different wave count.
Some of the Cycle Analyst’s are stressing on the four years cycle which has come to unfold any day now since they are warning us for over a year. What they in general do is base their calculations on the DJIA but look at the differences here in our own index the AEX (even the Brits went along with us) the low was not in October 2002 it was march 2003. If one has knowledge of the work of Mr. Benner the year 2003 has a completely different meaning it is almost magic so I come to one of my favorite adagia “Think out of the box”.
One of the greater masterpieces of Mr. Gann was the matching techniques of time and price in a number of different forms which for obvious reasons I can not share in detail simply because a simple Dutch Clown does not quite fully understand (yet?) the masters work as well and I had to even go beyond the instructions I have found in the liturature. The 478,44 with some creative thinking could be matched to an important top in may in this technique but baring in mind that the next date is September 30 brings a new dish on the table.
Intraday the movements will be watched on an hourly graph with Gann Fan’s, RSI and stuff so it becomes crystal clear when the picture changes. The Gann Fan’s, if scaled correctly, provide excellent trading signals and enable me to trade to win for quite some time now although improvements are in process. If one is expecting that Technical Analysis and the advanced Technical Analysis is providing a crystal clear picture of how markets move I have to say you are in for a huge disappointment. In my view it is however possible to condition the market movements isolate a number of high probability opportunities in order to make solid consistent profits trading.
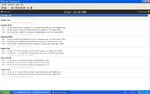
The Astronomy aspects I used to provide are put into a calendar and I have made a screen print so you can read this weeks trading set-ups. For the non Dutch readers I did not translate all bits so: OK is open buy OV open sell SK is close buy SV close sell. The Astro aspects occur at exact moments but what I have done is allow a tolerance of a couple of day’s and matched my database with 30 years or so AEX EOD data. Each set-up had either Rew or Risk attached to it; meaning that Reward or Risk has been optimized result wise. The first percentage is the amount of positive results (xxomxx grootste: win % verlies %) first xx is the number of positive results the second the number of negative results grootste means largest win % is clear and verlies means loss. I am still looking for a suitable format to use the data, the calendar form might be an improvement tough leave the interpretation of the hard facts to individual judgments. Use the facts flexible and bare in mind that all the banking phrases like past performance is no indication for future performance are a fact of life.
For cross check purposes I have a quick look at the DJIA although the quality of the data feed is not the same level I have realized in the AEX. The intraday data misses too much Ticks so intraday swings are missed and even a number of day highs and/or lows differ. It is however as stated an indication of direction which will not be that much different from the AEX. The Elliott Wave Analysis 30 year overview has a preference for a wave (1🙂 starting at 7197 upwards, which has a first sub wave at 10984 (1:1) and since then is in wave two(1:2). This second wave has its first wave on 10000 (1:2:A) and second on 11670 (1:2:B) so we currently have wave 3 down (1:2:C). What might be of interest now would be answers to questions like is 11670 it for now and how far down might the present wave down run.
So we will look in a bit more detail to the wave pattern from 11670 which is the above 1:2:C which has to be placed before the next wave labels. It might not surprise you that a first wave will be found at 10699 and a second at 11256 so we currently have wave three down. The fun part starts with combining the preferred wave pattern with Gann Fan’s and TA indicator stuff. A first pause was found right there where the first wave was placed and this again is something that can be found in several techniques. We continue our journey into even deeper sub waves by having a closer look at that third wave starting at 11256 is this fun or what. Again we find a first wave at 11066 and a second wave at 11174 so again a third wave down. This third wave has met already targets 11030, 10985 and 10870 leaving open just the last at 10686. Just one level deeper we find waves: 11028 1; 11151 2; 10701 3; and 10759 4; so if correct the last one 5 down with target 10618 because it relates to wave 1.
You will have to realize that we are in deep down the waves that things will change intraday for instance if the above wave 4 will be taken out Monday. Experienced Elliot Wave Analysts will immediately be able to redirect and place critical levels where a wave 4 can’t be a wave 4 anymore and depending on the added index data adjust wave counts. I will not monitor in such detail because I make my living trading futures on the AEX index.
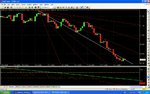
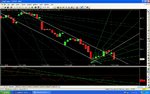
For intraday cross check purposes I have compiled an hourly data file (DJIA) and did some calculations on the scaling but it is in the very early stages so please bare in mind this when reviewing the graph. The Friday close is slightly above the trending downwards Gann Fan line with a definitely oversold RSI, both indications that an end to the present wave down might be nearby.
Groet en S6 remember Trade to Win.
Disclaimer:
All the above information is for educational purposes only.
The weekly update has a top down approach and therefore begins with a long term overview starting with the Elliott Wave Analysis using a data feed of over 30 years EOD data having a closer look at the last (current) wave up from 217,80 in march 2003. For the last months we are looking at the preferred wave pattern called TripleZigZagC with a third wave (Y) on 478,44 (April top) and a fourth wave (X) on 409,56 (June low) leaving us today in the fifth wave up. I have to express serious doubt about this scenario not so much of influence for the short\medium term roadmap but a little bit further down the road. In all honestly I have to admit that it is not so much the Elliott Wave Analysis that provides me with these thoughts but the other used techniques. To complete the Elliott Wave long term picture the route is up only not as much as the current preferred wave count might indicate, I am looking for a wave Y that is being place a bit higher. Wave Y has met its first target at 455,86 and after setting a high at 478,44 took quite a dive to 409,56. The next target for wave Y is 516,32 and remember this second target because this level is coming from other techniques as well. (my first postings at this forum)
Let’s have a closer look at the sub-wave (of the above wave five) we find a first wave 409,56-444,38 and note that 444 is the 50% retracement level of 478,44-409,56 which according to Mr. Gann his findings is by far the most important level and last day’s movement showed him right again let us focus next on the 426 level which is the 50% level of 409,56-444,38 and will play its roll the next couple of day’s. From an Elliott wave point of view a second wave to the above mentioned first and if we look at the time relationship it becomes clear that the second wave should not run much longer because on the 20th it is as long as the first wave and that is not typical for a second wave. To complete the whole picture here, Yes Sir it might result in a different wave count.
Some of the Cycle Analyst’s are stressing on the four years cycle which has come to unfold any day now since they are warning us for over a year. What they in general do is base their calculations on the DJIA but look at the differences here in our own index the AEX (even the Brits went along with us) the low was not in October 2002 it was march 2003. If one has knowledge of the work of Mr. Benner the year 2003 has a completely different meaning it is almost magic so I come to one of my favorite adagia “Think out of the box”.
One of the greater masterpieces of Mr. Gann was the matching techniques of time and price in a number of different forms which for obvious reasons I can not share in detail simply because a simple Dutch Clown does not quite fully understand (yet?) the masters work as well and I had to even go beyond the instructions I have found in the liturature. The 478,44 with some creative thinking could be matched to an important top in may in this technique but baring in mind that the next date is September 30 brings a new dish on the table.
Intraday the movements will be watched on an hourly graph with Gann Fan’s, RSI and stuff so it becomes crystal clear when the picture changes. The Gann Fan’s, if scaled correctly, provide excellent trading signals and enable me to trade to win for quite some time now although improvements are in process. If one is expecting that Technical Analysis and the advanced Technical Analysis is providing a crystal clear picture of how markets move I have to say you are in for a huge disappointment. In my view it is however possible to condition the market movements isolate a number of high probability opportunities in order to make solid consistent profits trading.
The Astronomy aspects I used to provide are put into a calendar and I have made a screen print so you can read this weeks trading set-ups. For the non Dutch readers I did not translate all bits so: OK is open buy OV open sell SK is close buy SV close sell. The Astro aspects occur at exact moments but what I have done is allow a tolerance of a couple of day’s and matched my database with 30 years or so AEX EOD data. Each set-up had either Rew or Risk attached to it; meaning that Reward or Risk has been optimized result wise. The first percentage is the amount of positive results (xxomxx grootste: win % verlies %) first xx is the number of positive results the second the number of negative results grootste means largest win % is clear and verlies means loss. I am still looking for a suitable format to use the data, the calendar form might be an improvement tough leave the interpretation of the hard facts to individual judgments. Use the facts flexible and bare in mind that all the banking phrases like past performance is no indication for future performance are a fact of life.
For cross check purposes I have a quick look at the DJIA although the quality of the data feed is not the same level I have realized in the AEX. The intraday data misses too much Ticks so intraday swings are missed and even a number of day highs and/or lows differ. It is however as stated an indication of direction which will not be that much different from the AEX. The Elliott Wave Analysis 30 year overview has a preference for a wave (1🙂 starting at 7197 upwards, which has a first sub wave at 10984 (1:1) and since then is in wave two(1:2). This second wave has its first wave on 10000 (1:2:A) and second on 11670 (1:2:B) so we currently have wave 3 down (1:2:C). What might be of interest now would be answers to questions like is 11670 it for now and how far down might the present wave down run.
So we will look in a bit more detail to the wave pattern from 11670 which is the above 1:2:C which has to be placed before the next wave labels. It might not surprise you that a first wave will be found at 10699 and a second at 11256 so we currently have wave three down. The fun part starts with combining the preferred wave pattern with Gann Fan’s and TA indicator stuff. A first pause was found right there where the first wave was placed and this again is something that can be found in several techniques. We continue our journey into even deeper sub waves by having a closer look at that third wave starting at 11256 is this fun or what. Again we find a first wave at 11066 and a second wave at 11174 so again a third wave down. This third wave has met already targets 11030, 10985 and 10870 leaving open just the last at 10686. Just one level deeper we find waves: 11028 1; 11151 2; 10701 3; and 10759 4; so if correct the last one 5 down with target 10618 because it relates to wave 1.
You will have to realize that we are in deep down the waves that things will change intraday for instance if the above wave 4 will be taken out Monday. Experienced Elliot Wave Analysts will immediately be able to redirect and place critical levels where a wave 4 can’t be a wave 4 anymore and depending on the added index data adjust wave counts. I will not monitor in such detail because I make my living trading futures on the AEX index.
For intraday cross check purposes I have compiled an hourly data file (DJIA) and did some calculations on the scaling but it is in the very early stages so please bare in mind this when reviewing the graph. The Friday close is slightly above the trending downwards Gann Fan line with a definitely oversold RSI, both indications that an end to the present wave down might be nearby.
Groet en S6 remember Trade to Win.
Disclaimer:
All the above information is for educational purposes only.