You are using an out of date browser. It may not display this or other websites correctly.
You should upgrade or use an alternative browser.
You should upgrade or use an alternative browser.
I'm still bullish on stock. i also bought some Calls today in the Aprl 2500 strk @ 3.5
Altho there seams to be some profit taking going on at the mo. I'm expecting it to go well above the 2100 soon.
Anyone else shares this view? AZN are still buyers! which indicates the stock is still in demand.
bull
RNS Number:5417I
AstraZeneca PLC
14 February 2005
REPURCHASE OF SHARES IN ASTRAZENECA PLC
AstraZeneca PLC announced that on 11 February 2005, it purchased for
cancellation 750,000 ordinary shares of AstraZeneca PLC at a price of 2093 pence
per share. Upon the cancellation of these shares, the number of shares in issue
will be 1,641,476,258.
G H R Musker
Company Secretary
14 February 2005
This information is provided by RNS
The company news service from the London Stock Exchange
I'm bulliah as well but will wait for further confirmation of strength - that longterm downtrend resistance could be hard to penetrate although I like the first double bottom rather than a new low. For me the trade is only half there - I'll miss some of the move but there you go.
Regards
Regards
AZN - All points to a sell now. Triple divergence - failure to break longterm downtrend. STOP 2,200 target 2050 and potentially 1850.
UK market as a whole - who knows?? I do know that we've had tons of crackin results coming thru over the past month or so - banks and oils especially - has the FTSE raced ahead as you'd expect - no.
Does it remind you of Alex Elders Hound of the Baskervilles patterm? It should!
FN
UK market as a whole - who knows?? I do know that we've had tons of crackin results coming thru over the past month or so - banks and oils especially - has the FTSE raced ahead as you'd expect - no.
Does it remind you of Alex Elders Hound of the Baskervilles patterm? It should!
FN
AZN - more of a stand aside and watch this one. IMHO there's possiblities in all directions for this one. But i always keep in mind that the markets are designed to fool most people most of the time.For me the downtrend has temporarily been broken but on the daily charts the gaps make it very hard to get a good entry. I think there will still be a retracement in the price. Then after that who knows! It could bounce of the channel or near support. Or it could visit 1.8 area...
Fastnet - Are you looking at daily charts? Because it certainly doesn't remind me of Hound of the Baskervilles pattern on the FTSE. If you want me to explain how this pattern works i'm more than willing.
Fastnet - Are you looking at daily charts? Because it certainly doesn't remind me of Hound of the Baskervilles pattern on the FTSE. If you want me to explain how this pattern works i'm more than willing.
Sorry - didn't explain myself properly. I think the FTSE is similar in concept to the Hound of Baskerville whatnot.
All I mean is that if all fundamental news say a certain thing should happen (excellent results and more M&A activity SHOULD make for very bullish FTSE) but it doesn;t happen (and it hasn't really) then this makes the opposite more likely.
I'm short the FTSE as a whole. Something's holding it back.
I would be interesting in talking about triple divergences and ''Hound o Bask'' set ups in FTSE 100 shares on daily charts. As Elder says they're rare but worth waiting for.
However I always seem to enter early - get stopped out only to watch the market slide in the originally anticipated direction.
How about you?
BTW have you been following Qwerty's thread. I reckon he uses a similar set up for his CFD trades.
Hounds!
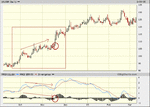
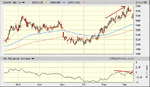
I didn't really understand this signal until i heard Elder explain in an interview. Which is available on his website (www.elder.com). Then it clicked. Here's a quick example of one. It's not the best example as I'm in a rush. But it is a Hounds signal. This chart of OOM shows the stock moving upwards. Note the area in the box, now as the stock moves upwards the MACD traces a negative or bearish divergence. Which normally indicates a small retracement or lower prices in general. But bearing in mind that this stock is in a strong upward move. A small correction was more probable. As we can see in this example the negative divergence of the MACD didn't follow through. And it quickly broke out a continued upwards instead of retracing or correcting any of the previous swing. This is a Hounds of the Baskerville signal. When the stock brokeout (areas marked with circles) upwards is confirmed the hounds signal. The breakout may have been a day when some news perceived as being positive was released it could have been an announcement, trading update, AGM, EGM, broker upgrade or something purely technical. When Elder means fundamentally changing, I think he means the markets perception of the value of OOM was fundamentally changing. Any fundamentals released around the time of the signal may help justify investors and traders actions like the example given above. The signal obviously works both ways. To spot opposite examples of this pattern. Then just check stocks that go into a downward trend, when they either make a countertrend move upward or trace a line, there's often a hounds signal involved in the MACD.
Hope that helps explain and i haven't seen qwerty's thread have to check them out.
Heres my new AOL journal
http://journals.aol.co.uk/chrisayresemail/TheModernStockTrader/
Attachments
Last edited:
Aye - thanks Techst (Chris?) - however can this pattern really be relied upon? It seems that the continuation move (Hound) after lower and lower MACD trace and triple divergence would be totally unexpected.
Also, since you were looking for a reversal move would you really change your mind-set so quickly and trade with the trend again after calling the MACD divergence a Hound?
What about the MACD divergences themselves - Elder calls them the strongest signals in TA. However I have been caught with false set-ups so many times and struggle to filter these traders successfully.
As mentioned I usually buy/sell just before the last gasp of the existing trend and get stopped out only to see the market reverse as originally anticipated. Any pointers? Do they work best in range bound markets? As you mentioned, in strong trends there usually is a dip after a divergence but it's often so small and short-lived that you'd have to catch it just write to take any points.
Did you read Elders Jan letter in which he describes using divergences to filter false break outs?
Cheers
Yes i have the emails saved i'll have to go back to that one and check it out. Elder states that divergences are the strongest signal in technical analysis, and I believe that it's certainly one of the strongest. So, if this strong signal fails. Then a signal failure of a strong signal is then even stronger. And what he advises and i would if playing this type of move is using a stop reverse order. If your broker permits of course. There for, if the strongest signal fails, then it produces a stronger signal using a stop reverse would see you through that signal failure and able to profit even though the move went in the opposite direction.
The idea of divergences as with most approaches labled trend following, is to wait for confirmation in price first. So maybe a 13EMA with a two day close of the EMA inside the price. This works for me. Actually waiting for the MACD line (blue) to cross above the red. I know sometimes this means not getting the best entry, but it does then confirm the stock is moving in your favor. Look for high volume on upward moves and closes higher than the previous close on a two or three day basis. And a nice tip for our style that i come across, try plotting a 65,130EMA on a daily. Reason? This is a close to having a weekly 13and 26EMA you can get. Remember? factor of five. This makes what i like to call a value area. It works well on trending stocks and only consider going long in this value band. I hope that answers some questions. But, feel free to pick my brain cell again.
The idea of divergences as with most approaches labled trend following, is to wait for confirmation in price first. So maybe a 13EMA with a two day close of the EMA inside the price. This works for me. Actually waiting for the MACD line (blue) to cross above the red. I know sometimes this means not getting the best entry, but it does then confirm the stock is moving in your favor. Look for high volume on upward moves and closes higher than the previous close on a two or three day basis. And a nice tip for our style that i come across, try plotting a 65,130EMA on a daily. Reason? This is a close to having a weekly 13and 26EMA you can get. Remember? factor of five. This makes what i like to call a value area. It works well on trending stocks and only consider going long in this value band. I hope that answers some questions. But, feel free to pick my brain cell again.
But tht's just my point techst@ - if I had used stop reverse I would have been well out of pocket each time I traded the top/bottom too early using the MACD divergence. Each time there was one/two more pushes left in the original trend even though the divergence was clear. You can see this on any chart. So, the result was my being stopped out with a small loss and the cost in frustration to have my original judgement proved right.
So, techst@ - do you use Elders methods to buy value in trending stocks or so you try and pick market turns with divergences?
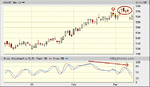
Actually I was very pleased with a BP short over the last few days. The last high looked weak and traced multiple divergences. I sold in 575 area with a stop at 580. After a first day of mounting losses as the stock rode up to challenge the latest peak once again it broke this morning and I covered at 564. Todays low was about 551 but I missed it.
So, after this minor victory what was it that made me switch into Elder II gear and buy a pullback in an established trend late this afternoon!!! How can you switch from reversal hunter to value buying? It's strange - only now I have an open long position do I look at the chart and realise how weak this chart looks. If the next rally fails to make a new high I'll be short at or before the 551 low.
Saying that I hope the rally allows me to get off the hook w/o giving my profits on todays short back. . . . . stupid eh.
One question - do you see the same divergence in the BP chart? Would you have traded it the same - does it pass your criteria?
Off topic a little but the BOOT chart keeps drawing me back in. That gap is just dying to be closed. Just waiting for a failure to make new lows and a solid up move. Any thoughts?
FN
So, techst@ - do you use Elders methods to buy value in trending stocks or so you try and pick market turns with divergences?
Actually I was very pleased with a BP short over the last few days. The last high looked weak and traced multiple divergences. I sold in 575 area with a stop at 580. After a first day of mounting losses as the stock rode up to challenge the latest peak once again it broke this morning and I covered at 564. Todays low was about 551 but I missed it.
So, after this minor victory what was it that made me switch into Elder II gear and buy a pullback in an established trend late this afternoon!!! How can you switch from reversal hunter to value buying? It's strange - only now I have an open long position do I look at the chart and realise how weak this chart looks. If the next rally fails to make a new high I'll be short at or before the 551 low.
Saying that I hope the rally allows me to get off the hook w/o giving my profits on todays short back. . . . . stupid eh.
One question - do you see the same divergence in the BP chart? Would you have traded it the same - does it pass your criteria?
Off topic a little but the BOOT chart keeps drawing me back in. That gap is just dying to be closed. Just waiting for a failure to make new lows and a solid up move. Any thoughts?
FN
Attachments
Well I look for oversold and overbought conditions within trending markets. Simple as that. I use weekly just as much as daily on my analysis, and sometimes monthly to look at the real big picture. Nice short on BP although you should try running profits as they say. But in all fairness that gap would have made watch very closely.
"So, after this minor victory what was it that made me switch into Elder II gear and buy a pullback in an established trend late this afternoon!!!"
Was that in BP? Because a gap certainly isn't a pullback. There's lots of reasons not to be trading this one from the long side. And i would be looking to go long only within a daily 65 130EMA band. Anything else I'll just move on to the next chart. There is one exception to this. And that's a stock that has just broke a major downtrend. In this situation MACD's are gonna be flying above 0 and normally wouldn't trade. But a major break in trend would see me positioning myself on the first dip to then ride the new trend upwards. For examples of this see my old posts on CW and BAY. Use the search to dig them out. Looking for a change in trend represents the best time to get in. Trader Vic 1 and 2 by Victor Sperandeo studys this style. Sperandeos work is immense, definately two books you've gotta buy and study for our style of trading. I make i only going long when RSI is below 50 or piercing 50 and the MACD is below 0 and hooking round except for a change in trend as mentioned above.
As for BOOT, I wouldn't touch it with your capital. There's plently of set ups out about that are more attractive. I show you through some if you like. But maybe not on this board.
Attachments
You're right about that gap on the BP chart. Thing is the gap wasn't there when I placed the trade on Thursday (managed to get out b/e BTW - phew - stupid move). The gap was only shown on the chart yesterday - it's just the way Bigcharts shows prices - what ever the reason I should have covered my short for a profit and stood aside.
As for your style I understand now that you are looking for pullbacks - a bit like LBR's ''Holy Grail'' - so you probably wouldn't have taken the BP trade.
Do you mind my asking how you qualify the pulbacks? Do you wait until afer the first ''up-day''/white candle etc or do you simply buy into a falling market near the EMA or in a 'value zone'. The first method i safer but you end up sacrificing most of the potential upside - I have lost consistently using the second method - this is one area where I think Elder gives a bum steer. The larger the pullback the more chance the trend has run out of steam. Pullbacks in a healthy trend are very shallow and might be one/two days.
Do you not trade MACD divergences at all? This was one side of Elders teaching that I am trying to develop - Trader Vic's trend change set up sounds like Joe Ross's 1-2-3 . . . .
Thanks again for the tips and charts -
Have a good w/e - writing this with a Saturday morning hang-over - back to bed I think. . .
FN
Qualify pullbacks? Sounds complicated to me. I certainly don't buy in a falling market and all the questions your asking here you've asked me before. Just reread my the previous posts again. Your asking all the same questions in different ways and i can't sit here all day repeating myself.
"this is one area where I think Elder gives a bum steer"
Well i would'nt blame him for your trading results. I use the same concepts and have consistently been profitable. So its certainly not his method. But, i have read elder books over 10 times. Mainly the bits about triple-screen and how to use indicators. Read and reread til it sinks right through. You might realise that you missed something. If your willing to share some of your trades with me. Maybe show a chart of a losing trade you had or another entry your not sure on. I'm willing to help and give some ideas if you listen to what im posting, try some of the ideas i share, study, read, try again until you start getting those 'aha' moments when things click into place. What's your plan for the coming week? What stocks are interesting you?
Hold your horses techst@ - I'm not looking for personal tuition here. If I repeat myself it's because these are recurring problems I have with this type of pullback trade - that's all.
You have also made asumptions about my trading results. I am not assigning blame (or gratitude) to any single guru just pointing out that Elder's books, in my opinion, understate the risk and overstate the expectancy of certain set-ups. I have several styles of trading. I have used them all profitably at times. None of them are consistantly profitable.
I certainly don't want to enter into pointless banter. That really is a waste of both out time.
That said, should you still be willing, I would appreciate a chance to discuss some charts and set-ups. I shall pick out some charts this w/e and stick to Elder type trades.
FN
"understate the risk and overstate the expectancy of certain set-ups" Even if setups are 50/50 in terms of profitability risking 0.5,1.0,2.0% on each trade and using a respectable risk and reward ratios(1/2, 1/3, 1/4) you can still be consistently profitable. So theres no understatement of risk, you define the risk through your own money management. I just stick to one method and strategy and learn it inside out. I dont try to change my whole strategy when i have a few losses. And i would call Elder a Guru. Guru's normally have a magic method or a special technqiue that will work for one type of bull or bear market. His methods are based on the fact that markets swing from overbought and oversold. Theres no holy grail here.
Having said that. How do you find your setups? Do you use a Rating Plan? Just picking some charts myself too. Should be interesting to see what we both come up with.
Having said that. How do you find your setups? Do you use a Rating Plan? Just picking some charts myself too. Should be interesting to see what we both come up with.
Okay - here are the 'Elder' style charts that caught my eye:
SHEL: buy 492 on daily chart although big mACD divergence on last swing high. trget 510
Many of the FTSE top 20 are well off their highs with momentum divs are look weak. I'd be short:
HBOS @ 845 Tgt 780 Stop 880
LLOY @ 510 Tgt 460 stop 520
DGE @ 758 tgt 730 stop 770
I'd also sell NGT near 500
Also attached BG - short at 410 top 430. Tired looking trend, blow-off spike at last high. Large divergence on MACD.
Any thoughts?
Attachments
And:
ULVR buy@ 506 tgt 540 stop 490
RB buy @ 1627 tgt 1700 stop 1600
CBRY sell @ 515 tgt 490 stp 530
SAB buy @ 856 tgt 890 (re-test top) stp 840
GUS i climbs back to 925 area sell with stp 940 ish - too low now @ 918. Nice down channel. One of few.
If there is any particular interest I'll post the chart to make discussion clearer.
I should also mention that my stop is floating. I rarely wait for it to be hit. If the trade moves into a loss quickly then I'll consider my stop to cover position.
However if trade moves into profit I'll move my stop nearer to current price and, as quickly as possible move stop to break even (outside a sensible margin for typical daily volatility). I aspire to 'free' trades'. and value money lost when my stop is hit more than the opportunity cost (profit I would have had if I'd stuck to original plan). Very simply if you are prematurely stopped out of what would have been a winning trade for b/e you have lost nothing but the chance of profit. You live to fight another day and hopefully have learned something.
Simpler terms still - I hate to let a profit turn into a loss.
FN
Similar threads
- Replies
- 63
- Views
- 16K
- Replies
- 61
- Views
- 20K