You are using an out of date browser. It may not display this or other websites correctly.
You should upgrade or use an alternative browser.
You should upgrade or use an alternative browser.
ads57
Well-known member
- Messages
- 267
- Likes
- 4
IG charts are down.
Yes they are busy updating them with a new higher vertical scale. The markets have gone so high that they no longer fit on their old charts :cheesy:
Yes they are busy updating them with a new higher vertical scale. The markets have gone so high that they no longer fit on their old charts :cheesy:
😆 Cup of tea time.
Next week
ASX closed Monday, Australia reporting season kicks off.
US and Canadian GDP
US NFP.
New Zealand rate call
samspade79
Established member
- Messages
- 576
- Likes
- 25
dividends are income, so nothing i can do, only capital gains, can u convert dividends to capital gains?
Don't think so, its my personal services company.
ads57
Well-known member
- Messages
- 267
- Likes
- 4
😆 Cup of tea time.
Next week
ASX closed Monday, Australia reporting season kicks off.
US and Canadian GDP
US NFP.
New Zealand rate call
Enjoy your long weekend 👍
Absolutely , it is the selling that keeps this market going
Currently net long, as the long Dow position is double that of the short Dax
Closed the long position exactly after the close following the rally.
Underwater though, although the Dow was double position , the Dax advanced much more money wise, go figure !!
For the moment keeping the Dax short.
Have a great weekend
brewski1984
Senior member
- Messages
- 2,067
- Likes
- 355
Closed the long position exactly after the close following the rally.
Underwater though, although the Dow was double position , the Dax advanced much more money wise, go figure !!
For the moment keeping the Dax short.
Have a great weekend
You've closed the winner and you're letting the loser run?
DAX gone past 7800 11 times in history and 8 times gone to 8000.
8 were in a uptrend. should be at 8145 to keep pace with the DOW for the month.
Resistance look's around 7910, 7930, 7960 and 8000
Support 7800, 7817, 7833, 7841, 7848 and 7854.
DAX longs will be my play for next week.
See if we can get 8000 next week with 8145 the aim for the next 4 to 6 weeks.
Or could do DAX long and DOW short, just need to be careful with DOW divs at the close.
what happens when /if it hits all time highs? will TA still work? i mean some people say history repeats but what if there is no history ? 🙂
Reinvent the wheel Dick, you could be the first.
Attachments

Dick Lexic
Veteren member
- Messages
- 4,954
- Likes
- 124
Reinvent the wheel Dick, you could be the first.
super conductors are the next wheel ....you heard it here first🙂
You've closed the winner and you're letting the loser run?
It was the spike just at the close and I knew it would fall back again so I gave it a shot. After that it retraced almost 25 points
DAX gone past 7800 11 times in history and 8 times gone to 8000.
8 were in a uptrend. should be at 8145 to keep pace with the DOW for the month.
Resistance look's around 7910, 7930, 7960 and 8000
Support 7800, 7817, 7833, 7841, 7848 and 7854.
DAX longs will be my play for next week.
See if we can get 8000 next week with 8145 the aim for the next 4 to 6 weeks.
Or could do DAX long and DOW short, just need to be careful with DOW divs at the close.
I agree Bus and Bre with both
My Dax short yesterday was more emotional than logical move
Nobody was to stand in front of an accelerating locomotive 😆
This is why I hedged with a double Dow position
Monday I'll need to find a better hedge or use a larger Dow position
6329 anyone
volatility expansion, stratospheric rise, back in the year 2000 or the end of the markets as we know it roll on OWC
What is OWC?
ads57
Well-known member
- Messages
- 267
- Likes
- 4
Morning guys,
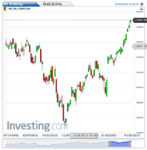
I have been looking at a daily chart of the Dow. What really strikes me is that we have had 12 up days in a row, where the market has closed higher than the open. Only 2 down days so far this month. I am looking at data for cash hours only.
Does anyone have any idea when this last occurred and how rare this type of market behaviour is. What is the likelihood that we will continue to see more up days next week ? I am going to look through my 2013 Stock Traders Almanac (http://www.amazon.co.uk/Stock-Traders-Almanac-Investor-Series/dp/111815987X) this weekend to see if it has any statistics on this.
To me this looks like climactic market behaviour and would indicate that we are about to see a decent pullback that should last at least a few days.
Attachments
Last edited:
SuddenDeath
Legendary member
- Messages
- 14,063
- Likes
- 143
M
malaguti
Morning guys,
I have been looking at a daily chart of the Dow. What really strikes me is that we have had 12 up days in a row, where the market has closed higher than the open. Only 2 down days so far this month. I am looking at data for cash hours only.
Does anyone have any idea when this last occurred and how rare this type of market behaviour is. What is the likelihood that we will continue to see more up days next week ? I am going to look through my 2013 Stock Traders Almanac (Stock Trader's Almanac 2013 Almanac Investor Series: Amazon.co.uk: Jeffrey A. Hirsch: Books) this weekend to see if it has any statistics on this.
To me this looks like climactic market behaviour and would indicate that we are about to see a decent pullback that should last at least a few days.
another buying opportunity..woo hoo
ads57
Well-known member
- Messages
- 267
- Likes
- 4
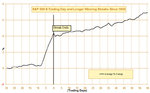
Following my earlier post, I found an interesting piece of analysis which indicates that a likely scenario is that we will see a pullback for around 4 days followed by a resumption of the uptrend at a more moderate pace :
$SPY Winning Streak Will End
By Christopher Mistal
Yesterday’s fractional gain kept the S&P 500’s winning streak alive and well at seven days. Should the S&P hold its gains today through the close, it will be just the 64th time since 1950 that the S&P 500 has booked gains on eight consecutive days. The last time this occurred was in November 2004 when the VIX was similarly low like now. In the following chart the average S&P 500 performance the 30 trading days before and 60 trading days after all 63 previous streaks of eight days or longer have been plotted. As you can see, the demise of previous streaks was not at all terrible.
Attachments
Similar threads
- Replies
- 1
- Views
- 3K