You are using an out of date browser. It may not display this or other websites correctly.
You should upgrade or use an alternative browser.
You should upgrade or use an alternative browser.
Anyone scalping the INDEX Futures??
- Thread starter Dowser
- Start date
- Watchers 3
D
Dowser
I follow it DT, I note the position of M5 closes in i.r.t the 5EMA. So today for eg. between 11.35 and 12.45 the closes were under the EMA. Indicating a continuing trend - I call this a fast trend. M15 closes either side of it's 5EMA is a slow trend. At the moment the price is bouncing about in a 25 point block so EMAs are useless. But if it was to breakout then the EMA can be a useful indicator.
D
Dowser
Looking at buying this breakout, lets see what this next m5 bar looks like?
D
Dowser
Looks decidedly dodgy
D
Dowser
Ok im long 18869. stop 10 tgt 25
D
Dowser
out -10 thats me done for the day!
D
Dowser
Bad trade sheer boredom!
Last edited by a moderator:
D
Dowser
The funny thing is, when I overlay all the indicators I use to use on the chart, they scream at me to do the exact opposite of my last two losing trades! One of the reasons I started this thread was because I've lost it a bit recently - so was trying to up my game and re-instill some discipline. I wanted to try a new approach with a clean chart and to just work off round number levels. I know it's only 2 trades but it's a bit frustrating...
timsk
Legendary member
- Messages
- 8,871
- Likes
- 3,577
Hi cbrads,The funny thing is, when I overlay all the indicators I use to use on the chart, they scream at me to do the exact opposite of my last two losing trades!. . .
There's a prevailing culture on T2W - and has been for some years now - that indicators are the spawn of the devil and should be avoided at all costs. They lag, they don't work etc., etc. If you have a methodology that you've tested, you're happy with and provides you with consistent profits - then sticking with indicators makes good sense. All that matters is that you understand how they work, what their limitations are and what it is that they're indicating. Too many traders who use them do none of those. So, my advice is don't be proud: if you can make money from a chart that looks like a Jackson Pollock painting - good on you!
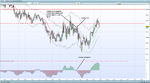
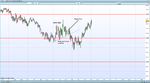
Having said all the above, I do subscribe to the idea that looking at a chart without indicators forces the trader to focus on price and what it's doing - as opposed to interpreting (often incorrectly) indicators. However, this won't do you much good unless you have some means of 'reading' price in order to make your trading decisions. I know the good folk on T2W are tired of me saying this - and not many of them agree with me - but I really do believe that for those of us who don't have the skills of someone like dbphoenix' for reading price - will find the task much easier by looking at a non-time based chart.

With this in mind, attached above is a Kagi chart (with moving averages!) and two longer term Heiken-Ashi charts showing where I think you entered your trade.
Tim.
D
Dowser
I follow it DT, I note the position of M5 closes in i.r.t the 5EMA. So today for eg. between 11.35 and 12.45 the closes were under the EMA. Indicating a continuing trend - I call this a fast trend. M15 closes either side of it's 5EMA is a slow trend. At the moment the price is bouncing about in a 25 point block so EMAs are useless. But if it was to breakout then the EMA can be a useful indicator.
Nice example of a 'fast trend' from 18.30
D
Dowser
Hi cbrads,
There's a prevailing culture on T2W - and has been for some years now - that indicators are the spawn of the devil and should be avoided at all costs. They lag, they don't work etc., etc. If you have a methodology that you've tested, you're happy with and provides you with consistent profits - then sticking with indicators makes good sense. All that matters is that you understand how they work, what their limitations are and what it is that they're indicating. Too many traders who use them do none of those. So, my advice is don't be proud: if you can make money from a chart that looks like a Jackson Pollock painting - good on you!
Having said all the above, I do subscribe to the idea that looking at a chart without indicators forces the trader to focus on price and what it's doing - as opposed to interpreting (often incorrectly) indicators. However, this won't do you much good unless you have some means of 'reading' price in order to make your trading decisions. I know the good folk on T2W are tired of me saying this - and not many of them agree with me - but I really do believe that for those of us who don't have the skills of someone like dbphoenix' for reading price - will find the task much easier by looking at a non-time based chart.
View attachment 231450
With this in mind, attached above is a Kagi chart (with moving averages!) and two longer term Heiken-Ashi charts showing where I think you entered your trade.
Tim.
I do know my indicators inside out and what they are can and can't do. If I use them with this in mind I can make money. Problem is, sometimes I've a tendency to switch off and have an over reliance on the signal they give without an appreciation of what's actually going on underneath. I don't think it's necessarily laziness - It's just that there is too much information on the screen and it's hard to maintain focus for extended periods. This was my rationale for getting rid of them and attempting to read the price. It maybe the case that this exercise just adds another string to my bow and I go back to my old charts. Either way, I think it's a worthy endeavour. I'm open minded and receptive to new ideas and I don't get bogged down with a lot of the dogma and zeal that some traders cling to. So, with this in mind, I thank you for introducing me to the non-time-based charts, I can see that there are many advantages with this approach to filtering price information and will study the charts that you have kindly created thoroughly. Cheers Tim you're a gent.
D
Dowser
The funny thing is, when I overlay all the indicators I use to use on the chart, they scream at me to do the exact opposite of my last two losing trades! One of the reasons I started this thread was because I've lost it a bit recently - so was trying to up my game and re-instill some discipline. I wanted to try a new approach with a clean chart and to just work off round number levels. I know it's only 2 trades but it's a bit frustrating...
I've attached two charts below. The first with all my indicators, the second: the clean chart I was attempting to trade today. Both with the losing trade highlighted. I think it's an interesting exercise to compare the completely different signals I was getting from each.
Attachments
darktone
Veteren member
- Messages
- 4,019
- Likes
- 1,086
I follow it DT, I note the position of M5 closes in i.r.t the 5EMA. So today for eg. between 11.35 and 12.45 the closes were under the EMA. Indicating a continuing trend - I call this a fast trend. M15 closes either side of it's 5EMA is a slow trend. At the moment the price is bouncing about in a 25 point block so EMAs are useless. But if it was to breakout then the EMA can be a useful indicator.
Sounds like it rings a bell. I did a thread a while back that defined trend with a close around an MA. That thread was a bit of a turning point for me, I was trading with fear. Might help you in a 'what not to do' sense.
You might want to look into trading the direction of your slow trend and positioning by fading the fast trend signal. The thing is youll still likely give back big when the slow signal starts to chop, its the same with all confirmation derived signals.
D
Dowser
I'll check it out, cheers DT 👍
D
Dowser
Can we get up to 18900 at the open?
D
Dowser
Res at 18900? I've one eye on my indicators today and they say the price is strong and going through...but it the top of a H1 candle would also present a good selling opportunity...lets see
D
Dowser
Indicator says buy, I'm not going to though as they have been know to lie to me and make me look foolish
D
Dowser
Selling here 18848 stop 10 tgt 25
D
Dowser
out -10 me and my 10 point stops🙄
D
Dowser
I thought the price would drop right through 18850. Was getting sell signal from indicator too.
Similar threads
- Replies
- 120K
- Views
- 12M
- Replies
- 33
- Views
- 9K
- Locked
- Replies
- 2K
- Views
- 223K
B
- Replies
- 1
- Views
- 3K
- Replies
- 0
- Views
- 4K