Hi Everyone,
I just started trading emini NQ and Dow using the method attached with some success,
please have a look, and let me know what you think.
I am Chinese, English is my second language, please bear with me if you don't understand me occasionally.
Cheers.
Lux
Bubble and Bounce Scalp (BBS)
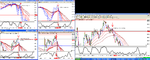
I use Hull’s moving averages to scalp (workable if you use GMMA, please Google GMMA to read how Daryl Guppy interprets short term and long term relationships), they are 3,5,7,9,11,13,21,24,27,30,33,36,55,60,65,70,75,80 exponential moving averages. In my mind they represent short term middle term and longer term market participants.
Stochastic: 10, 3, 2 overbought 90 oversold 10
Time frames: 3m, 5m, 15m, 144 tick
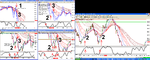
Theory: when short term moves too far away from main trends, a bubble will be formed, and it needs to be broken and therefore collapse back to main trends to either get more strength to continue (bounce) or persuade other participants (longer termers) to join the collapse.
Compression of the spacing between moving averages means agreement between short termers and longer termers, expansion of the spacing mean disagreement, in other works, the market is having a supply and demand problem when you spot a bubble or bounce, you should then set up a scalp trade in the direction of the market agreement (bounce) or disagreement (Bubble). Market needs agreement from supply and demand sides to proceed, therefore bubbles and bounces come in cycles.
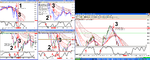
Bubbles and bounces in longer time frames have more strength than ones in shorter time frames.
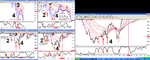
A bubble is formed, when supply and demand is imbalanced, therefore bubbles need to be grounded onto the main trend for the market to generate an answer to the imbalance, it can be a bounce or main trend is smashed into joining the short termers. Generally speaking, it is easier to spot trend changing bubbles using longer time frame, they are more powerful.
How to spot a bubble or Bounce: I don’t know, but after some screen time, you should be able to recognize them with some ease.
Bubble: 3m or 5m Stochastic turns, and Doji candles or candles with long wicks (exhaustion), longer term moving averages pointing up (down) but short term down (up), more space in short term group becomes obvious.
Bounce: 3m or 5m stochastic turns, and Doji candles (exhaustion), longer term and short term moving averages both are pointing up (down) after short term group falls back to longer term group, both groups move in the same direction after compression.
Scalp trade set up: trade in the direction of the bubble (collapse) or bounce (compression), in other words, when scalping always take sides with the short term market strength (because we are scalping), if bubble is about to collapse, join the collapse, if short termers bouncing, join the bounce.
Only take trades from your 144 tick charts, and 144T Stochastic has to be the same direction of 3 or 5m stochastic, and take the trade when the confirming candle is about 20 trades to finish, no buy or sell when Stochastic is in overbought or oversold, always take trades after 144T pulls back if the market has gone 6 ticks away.
Trade Size: 2 contracts
Stop Loss: 8 Ticks for both contracts, first lot profit target 5 ticks, second lot 10 ticks, after market moved 6 ticks in your favour, move stop to 2 ticks below entry.
I use 15m to spot bigger bubbles and the overall market direction. I use esignal to set up charts, because this method requires screen time to familiarise yourself with bubbles and bounces, it is preferable when setting up charts, don’t choose auto scale your charts, it helps you properly estimate the size and strength of the bubble or bounce.
I just started trading emini NQ and Dow using the method attached with some success,
please have a look, and let me know what you think.
I am Chinese, English is my second language, please bear with me if you don't understand me occasionally.
Cheers.
Lux
Bubble and Bounce Scalp (BBS)
I use Hull’s moving averages to scalp (workable if you use GMMA, please Google GMMA to read how Daryl Guppy interprets short term and long term relationships), they are 3,5,7,9,11,13,21,24,27,30,33,36,55,60,65,70,75,80 exponential moving averages. In my mind they represent short term middle term and longer term market participants.
Stochastic: 10, 3, 2 overbought 90 oversold 10
Time frames: 3m, 5m, 15m, 144 tick
Theory: when short term moves too far away from main trends, a bubble will be formed, and it needs to be broken and therefore collapse back to main trends to either get more strength to continue (bounce) or persuade other participants (longer termers) to join the collapse.
Compression of the spacing between moving averages means agreement between short termers and longer termers, expansion of the spacing mean disagreement, in other works, the market is having a supply and demand problem when you spot a bubble or bounce, you should then set up a scalp trade in the direction of the market agreement (bounce) or disagreement (Bubble). Market needs agreement from supply and demand sides to proceed, therefore bubbles and bounces come in cycles.
Bubbles and bounces in longer time frames have more strength than ones in shorter time frames.
A bubble is formed, when supply and demand is imbalanced, therefore bubbles need to be grounded onto the main trend for the market to generate an answer to the imbalance, it can be a bounce or main trend is smashed into joining the short termers. Generally speaking, it is easier to spot trend changing bubbles using longer time frame, they are more powerful.
How to spot a bubble or Bounce: I don’t know, but after some screen time, you should be able to recognize them with some ease.
Bubble: 3m or 5m Stochastic turns, and Doji candles or candles with long wicks (exhaustion), longer term moving averages pointing up (down) but short term down (up), more space in short term group becomes obvious.
Bounce: 3m or 5m stochastic turns, and Doji candles (exhaustion), longer term and short term moving averages both are pointing up (down) after short term group falls back to longer term group, both groups move in the same direction after compression.
Scalp trade set up: trade in the direction of the bubble (collapse) or bounce (compression), in other words, when scalping always take sides with the short term market strength (because we are scalping), if bubble is about to collapse, join the collapse, if short termers bouncing, join the bounce.
Only take trades from your 144 tick charts, and 144T Stochastic has to be the same direction of 3 or 5m stochastic, and take the trade when the confirming candle is about 20 trades to finish, no buy or sell when Stochastic is in overbought or oversold, always take trades after 144T pulls back if the market has gone 6 ticks away.
Trade Size: 2 contracts
Stop Loss: 8 Ticks for both contracts, first lot profit target 5 ticks, second lot 10 ticks, after market moved 6 ticks in your favour, move stop to 2 ticks below entry.
I use 15m to spot bigger bubbles and the overall market direction. I use esignal to set up charts, because this method requires screen time to familiarise yourself with bubbles and bounces, it is preferable when setting up charts, don’t choose auto scale your charts, it helps you properly estimate the size and strength of the bubble or bounce.
Attachments
Last edited: