Technical Analysis An Example of Tape Reading

This brief video clip is one of a growing library of over-the-shoulder videos I have made to help people learn tape reading by seeing examples for themselves. They are not structured teaching videos as such, more commentary.

As they were created live at the time I was able to point out some of the features as different participants including market makers and ECNs moved in and out of the bid and ask sides and other factors as well, such as the trades printing off on Time and Sales and so on. Because they are live it simply isn't possible to mention every single factor influencing the moves in the time frame of the action, so they are worth watching several times to spot all the influences.

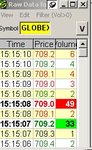
In this particular video you will see my trade of 1000 shares flashing through on Time and Sales a second after I call the short. Within 37 seconds the position was already $140 into profit and still running - and without the stock moving a single cent against me at the time of entry.

This is high probability trading for either pure scalps or scalping entries into swing trades.

Click here to view the video (will appear in new window).
 
Last edited by a moderator:
In scalping timing is king.
I rated this a 10.
Although I would have taken it a few seconds earlier.
 
Interesting articles - will look at the video later and comment - my current connection is too slow.
 
If you can perfect your entry so it immediately carries you into profit, like Richard has shown here then you can keep tight stops, which greatly affects your risk reward ratio. Forget 3:1 RR, more like 10:1 minimum.

Great entry Richard! Just takes hours and hours of eyeballing L2 to perfect it or coaching by Richard.
 
Last edited:
PitBull said:
If you can perfect your entry so it immediately carries you into profit, like Richard has shown here then you can keep tight stops, which greatly affects your risk reward ratio. Forget 3:1 RR, more like 10:1 minimum.

Great entry Richard! Just takes hours and hours of eyeballing L2 to perfect it or coaching by Richard.
Small problem - the video opens in Windows Media but I only have sound - no video.

Is it working OK for everyone else?

Cheers,
 
Works with realplayer - save link RHAT.wmv then view with realplayer
robq
 
Thanks robq,

I got it - I just had to make the video full screen - then it appeared?

I have rated this a 7 - the reasons as follows:

1) Not enough clarity in the setup - no LevII for evaluating exit price for quick exit if needed
2) Trade appears to be taken on the break of an even number - I would have waited for the retest of the most recent 2 candles - and entered on the breakdown. RHAT has already made a large % move!
3) No reference to what type of day we are in - is it Intraday or Outside Day.
4) No reference to whether the prints are going off at the BID or ASK - what are the ratios - also no BID / ASK on Tape

I am not doubting Richards ability, just voicing my opinion in relation to what I see in the article.

Regards,
 
I too have to echo the some of the comments raised about the entry..

Richard points out the decade number and you can see the "false floor demand" being put in to allow some covering / adding on the upticks. The shadows around 20.20 level and the narrow spread bars just after ( no doubt on low vol ) gives game away . So why wait for the break of the decade for a second time when you can anticipate it & enter with a 10 cent stop around the 20.13 level :?:

I do trade a lot of Nasdaq stocks and if people go over the old US day traders thread, you find a good few examples of this type of pattern trade that I and some others including PitBull put up :).

I think the video is just highlighting a very basic snap shot so a novice could gain an idea of what to look for, in a possible trade set up on the break of a decade number. I think its a little unfair to criticise it to harshly when its viewed in that light.
 
Last edited:
Good point Bez - but I will add.

1) As per your input - different traders will have different opinions as to what constitutes a high probability trade.
2) For beginners, especially if you are offering a training service, I think the focus should be on how to exit quickly if you are wrong - not on when to enter for the best fill price.
3) If I was considering obtaining training from another trader - then first impressions mean a lot to me - for me that means if someone takes the time to go into detail to get their point across more clearly, then they will more than likely continue that level of detail with their training.

I will also note that Richard states this video is not a training video - more a commentary.

That said, Grey1 has a brilliant TT private group setup, where all the details (including the tradestation codes) are freely given - all you have to do is a little investigative work to dig out previous posts on how his system works (and it does work as the proof is posted) - and he also does it for free.

I have also set up a private CTM group for Conventional Trading Methods - with a view to providing a serious forum for traders to learn from each other - for all levels - beginners to full time traders. I am not surprised at the slow uptake for traders to join in and start posting screenshots of their trades (which is the main focus of the CTM group) - as the majority of new traders have to go through the "show me what works" phase - insted of accepting the fact that trading is a very personal endeavour, and just because one trader is using a certain approach for trading does not mean that approach will be effective for another trader.

Also, what about the traders who can't afford to go fulltime, or only have a small amount of capital and will never be able to put up the $25K daytrading margin, or have family commitments that only allows them to trade a few hours each week, etc,etc..What about letting these traders know of the options that are available to them in relation to trading stocks -
1) You can trade the SSF's with small capital and the $25k rule does not apply as they are futures - also no uptick rules.
2) You can trade the YM - again small margin requirements and no uptick rules.
3) You can trade the ES E-mini - similar to the YM (DOW30) but based on the S&P 500 stocks as opposed to the DOW 30

In summary - as I am not trying to highjack this thread - the main point I am trying to make is that traders need to be aware of all their options. If the do decide to pay someone for training, then the should be well informed as to the what the expected outcome is.Snippets of information, IMHO, is not the most appropriate way to promote an effective and adaptable trading methodology.

This of course, is just my opinion!
 
Hi Richard,
Thanks very much for posting.
Some great follow ups from others as-well.
Reminds me of the (much missed) late great USA Traders thread.
 
Last edited:
Many thanks Richard for posting your video. Very interesting as always.

It's also good to see some others of the Chinatown Crowd posting and to know they're still alive! :cool:

Hope you're all well guys!
 
CYOF,
QUOTE
1) Not enough clarity in the setup - no LevII for evaluating exit price for quick exit if needed
2) Trade appears to be taken on the break of an even number - I would have waited for the retest of the most recent 2 candles - and entered on the breakdown. RHAT has already made a large % move!
3) No reference to what type of day we are in - is it Intraday or Outside Day.
4) No reference to whether the prints are going off at the BID or ASK - what are the ratios - also no BID / ASK on Tape
END QUOTE
1. You are correct in saying how vital the exit is. In this trade it was one cent against me. The momentum was overwhelming and the probability at the time of the short for this to reverse was about 10% - this is based on experience.
2. The short was taken before the break of the whole number as on the video. We had taken several trades in RHAT earlier - this was not the first !
3. Whether a stock is trading within or outside its previous day's range does indeed frequently matter as you rightly say. However, in this particular instance the selling pressure was so great that was not significant.
4. The trades printing off on the T&S in green are trades executed at the inside ask and those coloured red are trades printing off at the inside bid.
I hope that hepls.

PitBull, Samtron and jimmy1jag, Thanks for your comments and thanks to all who have emailed me.
PitBull, yes absolutely, the skills set using micro-analysis enables someone to trade on much higher Reward/Risk ratios and also with a much lower %age probability of failure on the individual trade.
jimmy, oh yes, a lot of the the ChinaTown crowd are alive and well and kicking ass in the markets day after day after day ;-))
They are simply not posting here.
Richard
 
Hi Richard,
An excellent and innovative contribution to the K Lab. Good to see you posting here; I hope it marks a return to the boards and isn't just a fleeting visit?!
Tim.
 
Mr. Charts said:
CYOF,
QUOTE
4) No reference to whether the prints are going off at the BID or ASK - what are the ratios - also no BID / ASK on Tape
END QUOTE
4. The trades printing off on the T&S in green are trades executed at the inside ask and those coloured red are trades printing off at the inside bid.
I hope that hepls.
Richard

Richard,

Thanks for answering my comments.

You might be able to clear up this question in relation to 4 above, as I was not aware (based on the software I have used to date) that it was possible to get the inside ask / bid to colour code print with the last traded price - it just shows you, you learn something new everyday.

My understanding to date is as follows:

1) On the T&S screen, if the next trade price is higher than the last trade price then the trade print is coloured green - if lower it is coloured red - if the same it is neutral.
2) The trade prints - either green, red or neutral - have nothing to do with the bid and ask prints.

For example:
The last trade price is 37.31(green) - the bid is now 37.29 and the ask is now 37.32
The next trade price hts the ask 37.32(green) - the bid is now 37.30 and the ask is now 37.31
The next trade price hits the ask 37.31 (red) - the bid is now 37.29 and the ask is now 37.30
The next trade price hits the ask 37.30 (red) - the bid is now 37.31 and the ask is now 37.33
The next trade price hits the bid 37.31 (green) - the bid is now 37.32 and the ask is now 37.35
The next trade price hits the bid 37.32 (green) - the bid is now 37.32 and the ask is now 37.34
The next trade price hits the bid 37.32 (ntrl) - the bid is now 37.31 and the ask is now 37.33
The next trade price hits the bid 37.31 (red) - the bid is now 37.29and the ask is now 37.32

Cheers,
 
Hello Tim,
I haven't decided yet
Richard

CYOF,
"4. The trades printing off on the T&S in green are trades executed at the inside ask and those coloured red are trades printing off at the inside bid"
Perhaps for added clarity I should have said. "......at the time of the trade."

The answers to your 1 and 2 are both no
and your examples are also not correct, although not necessarily always so.
I think if you consider the clarification phrase and watch the video clip a few times - perhaps keep stopping it and looking at the trades printing off, their colour and what then happened, if anything, to the bid and ask prices, then you will gain a better and deeper understanding for yourself
It's one of these situations when an illustrative video clip is worth a thousand words and is much easier to understand than ploughing through all the words on a page. What I'm saying is that face to face it's easy to explain in a few minutes but with my two finger typing it would take me a couple of hours - and you will understand if you do as I suggest in the previous paragraph.
 
CYOF said:
That said, Grey1 has a brilliant TT private group setup, where all the details (including the tradestation codes) are freely given - all you have to do is a little investigative work to dig out previous posts on how his system works (and it does work as the proof is posted) - and he also does it for free.
Grey1 is, of course, able to earn his living trading US stocks
 
Richard,

I will check this out as best I can in relation to my trading setup - but as I no longer have an e-signal data feed - and currently use QT with data feed from TD Ameritrade - it may be difficult.

I will also check my IB datafeed in the evening time after work.

This is a very important topic for me to follow up on - as I have always traded T&S as per my previous post.

The ability to identify red prints as trades that are always going of at the bid - and green prints always at the ask - is significant for me.

I will revert with my findings - as I think this is a very important point for all new traders to be aware of. If my setup does not do as you say - then we will have noted something very important in relation to timing entries using the tape. If it does, then it just goes to show you that you need to thoroughly understand what you are doing - and I thought that I knew tape reading fairly well :eek:

Thanks for shedding some light - and please do respond when I reply with my findings.

Regards,
 
CYOF said:
Richard,

I will check this out as best I can in relation to my trading setup - but as I no longer have an e-signal data feed - and currently use QT with data feed from TD Ameritrade -

Regards,
Hi CYOF
QuoteTracker does as you want. Right click a chart and select "Raw Data/Time&Sales" and you get red and green numbers, with block trades (you select the size) highlighted by red or green background. You can filter out small trades completely. See attachment.
pete
 

Attachments

  • QT T&S.jpg
    QT T&S.jpg
    60 KB · Views: 248
Thanks Peto - I have been using the Raw Data with QT for some time now - but it is obvious that I never read the manual.

Firstly, I must admit that I was wrong in my understanding of how the colour coding for the last traded price is printed. I really don't know why I took it as I described - maybe due to previous trading I had done - but the main thing is that I now fully understand how it works for the software I am using. Never be afraid to admit you are wrong - for you will make a lot of errors in the trading game.

There is an old saying - RTFM - which tends to repeat itself over and over again.

For those who never heard of it, it means - READ THE F*****G MANUAL

Anyway, thanks Richard for the feedback, and for all who have commented, as it has allowed me to correct one more of the many glitches which I need to address with my trading habits.

I will now look at T&Sales in a different manner - and hopefully this will lead to improved timing of entries for certain types of trades (especially sclaping of stocks) - which I consider to be very important.

Thanks again - and I am glad that I have learned something new today - I will be more thorough in the future.

Regards,
 
Top