Advanced Structured Forex Trading

Echelon4,

I forgot to post the chart in my last post to you, so I came back to do that here. You will have to shift the numbers that I posted forward by 1, to be on the right period on the chart and to see my point on how the historical trend came to an abrupt end at position number 9 on the chart and began moving sideways from there through position number 1.

Finally, here is the chart:
 

Attachments

  • EURUSD Daily Chart.jpg
    EURUSD Daily Chart.jpg
    350.1 KB · Views: 376
I'll get back to the questions later - I just needed to quickly post the chart for Echelon4, so that's why I came back. Of course, I could not resist TheBramble's commentary on God trading trends - so I popped that one in too. But, I really need to get back to some things today. Post your questions and I'll follow-up later.

Gotta jet out of here now.
 
7thSignalTrader said:
If God traded - He would "know" the so-called "trend" ahead of time given his Omni-Presence and His ability to know all things.

Therefore, He would be able to trade an event that had not occurred for “us” yet. For Him, the event has already “occurred”. In fact, taking this even further, there would really be no event that has not happened yet for God given his ability to know all things and be in all places at the same time.

So, really – God would already know each price point along the path that we ultimately perceive as he already knows the “trends” that mankind would create.

Mankind makes up the trend while God already knows it before it becomes our reality. Besides, I think God favors the TCD! :)

Hail to the new BAT!!!!!

With admiration...

rols
 
7thSignalTrader said:
Echelon4,

I forgot to post the chart in my last post to you, so I came back to do that here.

Hi 7th ,

You had me guessing at which chart you were going to post - and I was on the right lines. I'll now have a close study of that chart in conjunction with your helpful advice - many thanks !

It was fascinating to hear about your proposed research into TNCD's, I've got a feeling that could turn out really good - even it sounds as though you may need a couple more processors and separate linked instances of Excel :eek:

I think your advice on using data mining will prove to be invaluable, it looks as though the system docs. for the Weka system are pretty good so I'll spend a good deal of time studying those to get a total understanding of what the software is capable of. I've also bought the book written by the guys who developed the system. The book is more of a beginner's guide to DM, however it's perfect for me because I'm a total newbie when it comes to DM.

It's good to hear that you didn't find a need to backtest through a complex specially constructed suite of backtesting tools. For the sort of backtesting that I was thinking of, It makes good sense to just run data through the engine from a point in history - I would guess that rather than use DDE for real-time input, it will be necessary to have a special backtesting link to tick data stored in a database, plus a means of controlling the test start and end dates and a VBA macro to control the running of the test and the output of the results into a separate sheet (similar to your 280BT).

Hope this helps
As always, you've provided far much more information than I asked for and it's greatly appreciated !

Cheers

Mike
 
I'm not stepping into the argument over whether trends exist. I never claimed they did not exist. Whether or not they exist, what people interpret as trends are way over-used. This is evidenced by all of the people who are buying real estate for investment purposes right now who are going to lose their shirts.
 
Dm

echelon4x said:
Hi 7th ,

You had me guessing at which chart you were going to post - and I was on the right lines. I'll now have a close study of that chart in conjunction with your helpful advice - many thanks !

It was fascinating to hear about your proposed research into TNCD's, I've got a feeling that could turn out really good - even it sounds as though you may need a couple more processors and separate linked instances of Excel :eek:

I think your advice on using data mining will prove to be invaluable, it looks as though the system docs. for the Weka system are pretty good so I'll spend a good deal of time studying those to get a total understanding of what the software is capable of. I've also bought the book written by the guys who developed the system. The book is more of a beginner's guide to DM, however it's perfect for me because I'm a total newbie when it comes to DM.

It's good to hear that you didn't find a need to backtest through a complex specially constructed suite of backtesting tools. For the sort of backtesting that I was thinking of, It makes good sense to just run data through the engine from a point in history - I would guess that rather than use DDE for real-time input, it will be necessary to have a special backtesting link to tick data stored in a database, plus a means of controlling the test start and end dates and a VBA macro to control the running of the test and the output of the results into a separate sheet (similar to your 280BT).


As always, you've provided far much more information than I asked for and it's greatly appreciated !

Cheers

Mike

Hi echelon4x!

I am glad to see that you have developed interest in DM. I did do some basic work with Weka once, and I think this is one excellent tool, truly capable of doing actual data mining. I’ve talked to people who have also used the Neural Network portion of it, who were too satisfied.

I see quite an activity in this forum, and reading trough the last 30 pages that I had to catch up on (the last week or so), I realize this has been one of the most precious threads on these types of forums. I found many answers to my failed attempts to find repeatable data patterns using what the core element of 7thSignalTrader’s system – the TCD. When I say “my failed attempts”, I actually mean failed to produce accurate predictions for more than 65% of the time.

Speaking of Weka, I was interested in classifying under what conditions the initial move would expire. I find this amusing now since I’ve read 7thSignalTrader’s answer to someone just few days ago, that the initial moves are one of the hardest to predict in terms of size and time.

I read 7thSignalTrader’s advise to you, or a reply to you where he mentioned the phrase "raw data", and that your research should focus on finding repeatable deltas of size 30 pips. I started out with using raw data in my DM process, even though I had a clear understanding that DM tools, especially Neural Networks do require “meta data” in order to avoid “trend” related problems. /And Yes Sir I fully agree with 7thSignalTrader that trends do exist only in the past, but since we’re dealing with historical data, we must be aware of them. /

Raw data led in my case to conflicting results. So I switched to “meta data”: percent fill, percent change from previous bar etc. And still you’d be amazed to see that even then trends (historically speaking) do exist! Some DM tools provide “de-trending” mechanisms, but most of them simply “flatten” the data by applying a mathematical function, which is usually based on “log” or “tanh”.

I have learned some interesting things during my data mining projects related to this particular system. Perhaps I’ve mentioned this before (which agrees with 7th), weekly TCDs, especially Retention TCDs played the most important role in classifying and associating data and discovering patterns.

Since I didn’t have an interesting success/results with Weka I spent most of my time working on modeling Neural Networks again using solely the core of 7th’s system. The results were much better, and I am still working on improving and going higher than 75%, at the moment. I find NNs much more interesting and powerful than classifying and associating DM tools. Remember, classifying is based on data carrying historical events. 7th system is geared towards predicting “What must come next in order for the price structure to remain in tact.” These sort of calculations would be priceless in a DM tool! Otherwise, if you think about TCDs in general, I’d say about the Subordinate TCD - since it must remain the same in order to allow the Dominant to create a “Trend” (historical) then very little change would occur, which would make no difference to the DM tool. Sadly to say, TCD Short in current case would provide little if no importance to any DM model. The Dominant on the other hand, over time, is at around 65% fill the majority of the time, at the start of the day. Naturally you’d get results concentrated around 65% of accuracy. /Sort of take my word on the last two sentences, as I tried to compress what I want to say, and it's not as simple/

You may have heard about Neural Networks with ability to predict market Close Price with average of 90%+ success. You have to know what you’re after and how a certain given success ratio works for you. For example, a 90% of 100 pips is not bad at all. 90% though on 1.2890 is 1.1601. Setting up the “meta data” is an art, and actually the DM model too; extrapolating a formula that works is a science.

There’s a lot to DM than more people would think. There’s a lot to learn, not only about particular software package and its use, but also about you and you! At some point you and the system become one. /The perpetual question, who is smarter, the system or the human – does an English speaking person with a Chinese dictionary actually understands Chinese?/

Good luck with your future research projects.

I, myself have to catch up on few things that I’ve missed about 7th’s system and perhaps shoot out some questions too.

npn
 
echelon4x said:
Hi 7th ,

You had me guessing at which chart you were going to post - and I was on the right lines. I'll now have a close study of that chart in conjunction with your helpful advice - many thanks !

Yes – it is a “Daily” chart – so you can see the Daily TCDs visually without the numerical values behind them. Just follow the green to red circle combinations and vice-versa.

echelon4x said:
It was fascinating to hear about your proposed research into TNCD's, I've got a feeling that could turn out really good - even it sounds as though you may need a couple more processors and separate linked instances of Excel :eek:

TCD’s enables a while new world of data analysis into market behavior! What I’ve done over the past several years has only scratched the surface of what’s possible. Typically, the originator of something new does not fully tap all the potential of the new discovery. It will typically be someone coming behind the originator that pushes the new idea to its fullest potential. IBM > Microsoft. Wright Brothers > Boeing. Newton > Einstein. Things progress through innovative, outside the box thinking behind horizon. It takes imagination to see beyond, guts to do what others say can’t be done and enough faith to wait patiently on results.

echelon4x said:
I think your advice on using data mining will prove to be invaluable, it looks as though the system docs. for the Weka system are pretty good so I'll spend a good deal of time studying those to get a total understanding of what the software is capable of.

That’s the key. Figuring out if that tool will support the research. So, knowing what it is capable of doing first, will let you know whether or not it can help in ways that other tools can’t.

echelon4x said:
It's good to hear that you didn't find a need to backtest through a complex specially constructed suite of backtesting tools. For the sort of backtesting that I was thinking of, It makes good sense to just run data through the engine from a point in history - I would guess that rather than use DDE for real-time input, it will be necessary to have a special backtesting link to tick data stored in a database, plus a means of controlling the test start and end dates and a VBA macro to control the running of the test and the output of the results into a separate sheet (similar to your 280BT).

Yes – you will have to create your own method for back-testing inside of your development tool. This is not like TradeStations EasyLanguage. There is nothing “easy” about this. Everything must be built from scratch. TradeStation and the others don’t have the logical hierarchy necessary to build all the Indicators that come from the TCD concept. All the metadata (the majority of the 30 baseline indicators, etc.) need to be used inside a good TCD based system. The flexibility of most off-the-shelf “trade system development platforms” is simply not enough to build something like this given the structure of this type of system. The only way to code something like this outside of Excel would be in the OOP environment – C++ or Java, etc. But, then you run into a massive problem because in the beginning you are doing mostly research and not development. So, you end up running into time wasting procedures such continually having to compile .exe files just to see the results of minor changes and tweaks to the system – and a system like this undergoes a huge number of tweaks before you find optimal levels that meet your requirements on a daily basis. You can’t sit there compiling and re-compiling executables all day long as nothing else would get done.

After the system is completed, or after the majority of the system is completed, THEN it makes sense to move it into the OOP environment where most of the tweaks will already be done and the compile/re-compile for results on code changes won’t have such a time consuming impact. At that point, seeing your work in the form of a 32bit Windows Application would really be cool and rewarding! So, technically – what you see in my Dashboard is truly a “prototype”. However, since I have no desire to sell it – I really don’t need to convert it into a Windows app. I can continue to use it in its prototype form and whenever I need to make small changes (which I’m always doing anyway when I discover something new and better), I can simply code that very quickly in Excel and get instant feedback without compiling and re-compiling code.
 
TheBramble said:
So you're saying trends do exist?

I've said..... "trends don't exist for the trader". They do not exist from our frame of reference.

Check out the “Twin Paradox Theory” using space, time and distance as the framework for understanding “relativity”. Also, look-up the concept of mathematical “Transformations”. There are many different transformations to explore, but again – you can get an idea of the concept of events having a physical/relative relationship to each other.

The trader cannot experience a trend because he/she is not omnipresent and the trend has no physical extension beyond the past. The only extension a trend has relative to the trader is a logical extension – not a physical extension. Two entirely separate things.

God can see both, experience both and manipulate both. We can see one, experience one and manipulate neither.
 
Brabed said:
I'm not stepping into the argument over whether trends exist. I never claimed they did not exist. Whether or not they exist, what people interpret as trends are way over-used. This is evidenced by all of the people who are buying real estate for investment purposes right now who are going to lose their shirts.


TCDs applied to the Real Estate Market.

If REIT's are tradable using the OHLC format, then it might be worth exploring. Probably wound need Residential REIT and a Commercial REIT OHLC data to explore. Basic stock data with an underlying REIT at the instruments core. TCDs can be applied to any OHLC data format - like any other TA tool.
 
Hi 7th,

Thanks for your recent response - I agree, compiling code to do research would be a complete nightmare. An EasyTCDLanguage would be nice though lol !

Your post on trends where you mention relativity got me thinking back to something you said a few months ago in another forum I believe:

"There is a ton that I have absolutely no way of clearly explaining here, but you will note somewhere along the line that in space/time relativity, nothing can move faster than the speed of light, and it just so happens that this speed can be transformed/translated to precisely 45-degrees.

After 45-degrees, things in the market become fairly predictable for limited period of time. This is where the observant trader will go to work – during these times of space/time transition in price. It is like being able to walk between the dimensions of the trend itself – between those up and down transitions that make up the trend. Neat stuff, actually!”

Well, I bought the book "The Future of Spacetime" which you also recommended at the time and had a really good look through that introductory chapter.

I could see the concepts and how they could apply to price, but what really confused me is that you referred to the 45-degree chart (Hilbert Space Diagram ?). Price in the FX markets can move pretty quickly sometimes, though I've yet to see it move at the speed of light lol.

I also found some interesting references to transfomations in the book, such as the Galilean Transformation, however again as soon as we look into Lorentz Transformations then we need to be travelling very close to the speed of light for these to be of much use.

Because the speed of light is such a huge number, I'm just wondering how you can relate these relativistic ideas to the movement of "price".

Cheers

Mike
 
Hi npn,

Good to see you here and I hope your NN research is coming along nicely.

Hi echelon4x!
I am glad to see that you have developed interest in DM. I did do some basic work with Weka once, and I think this is one excellent tool, truly capable of doing actual data mining. I’ve talked to people who have also used the Neural Network portion of it, who were too satisfied.
This is very promising to hear - thanks for the "hands-on" evaluation. The last thing I fancy doing is spending days learning everything about Weka only to find that it can't do what I want it to do !

npn said:
Raw data led in my case to conflicting results. So I switched to “meta data”: percent fill, percent change from previous bar etc. And still you’d be amazed to see that even then trends (historically speaking) do exist! Some DM tools provide “de-trending” mechanisms, but most of them simply “flatten” the data by applying a mathematical function, which is usually based on “log” or “tanh”.

Very handy to know this as a DM "newbie".

npn said:
/Sort of take my word on the last two sentences, as I tried to compress what I want to say, and it's not as simple/

After looking at the myriad of options available in Weka, I never thought it would be easy lol !

It amazes me that there is "open source" software out there like Weka, used by various academic establishments for serious research, whereas to but software with similar functionality, I wouldn't mind betting that you're talking several thousand $'s.

npn said:
Setting up the “meta data” is an art, and actually the DM model too; extrapolating a formula that works is a science.

A very interesting take on what's involved in DM - I can see it's going to be tricky stuff. I'm tempted to persevere with "eyeballing" patterns in Excel for the time being, though the DM side of things will always be a backburner project.

Cheers

Mike
 
Last edited:
Neural Nets

Hi 7th,

We've exchanged a couple of emails/posts back in December regarding mostly Neural Networks. I've been following your posts with great admiration, and have been working my self on something that your system inspired. Back in December 05 reading your posts about 3-4 types of people (people who follow, people who do lead), I decided that I should try to take whatever you offer and do my own thing with it. I took the route of exploring solutions based on Neural Networks.

For over 5 months now, I have developed more than 1,500 models using 4 commercial Neural Network packages, and 1 proprietary Java based that I wrote myself. Your TCDs have been the core of all - started with about 6 elements that you've disclosed here and there, turned them into about 350, squashed them back to anywhere from 4 to 50, which I've used in my NN models. The last 4 months have been compressed with all the work that I've put, and unfortunately, that has been the reason for me not appearing on the many forums and fully following your posts. The last 2 weeks though, I've started to read and re-read all threads so I can catch up with the material.

I am at the point where my NN models got solid about consistent performance - a prediction with 10% error of daily highs and lows, for about 75% of the time. 75% on a daily basis is I think very good! Most NN models are based on at least weekly time frame, plus combing TA with fundamentals.

I felt that I might improve this, and this was the reason to go back to all forums and posts and look for further inspiration. I am glad that you're here and posting, sir! Unfortunately, I have realized that I have missed a lot, and I do have a few questions if you don't mind:

1) When you speak of % Fill, do you always compare apples to apples? Do you only compare TCDs to their own averages, or do you mix components e.g. TCD/DAPD or Weekly TCD/Monthly TCD?
2) Speaking of Weekly and Monthly elements, do you see advantage in using calendar week and month (I presume so) vs the last 7 or 30 days and the corresponding Highs and Lows.
3) How do you select the period of averaging you components going into larger time frames? For example, do you average weekly TCD on 4 since there are 4 weeks in a month?
4) (You've spoken least about probabilities) Do you use historical reference in a form of a look up table, where you pick what happened previously given the current circumstances?

I'd better stop with the questions... I do realize that you can't disclose all, and also that you've answered so many questions already, but given the fact that some posts are missing etc, I had to ask.

Thanks in advance!

npn
 
Last edited:
5/1/06 to 6/1/06 Outlook Notes and Observations

Results:

Not good. The $1.2614 Short down to the $1.20XX level resulted in a 200+ pip loss on monthly Outlook trade of 100 lots. That's the second long-term trade that failed. One Swing and one Outlook, both Shorting against the "historical trend".

Of course, since the inclusion of the Annual TCD data, I now know that both of those signals would never have been allowed to come to screen and would have been overridden by the much larger Annual TCD Long probability which is still unwinding to the upside for this year. So, I'll have to wait until the Annual TCD Long Fill$ to near capacity and then watch the behavior of the smaller TCDs at that point. Can't wait!


New Developments:

Ok - the Annual data has given me a lot to work with - a playground of sorts - so, I'm still exploring a couple new ideas and have built a new tool for testing Day Trade entry points using the Annual input in a number of various ways. The goal in the way I trade is to capture a minimum number of pips every 24 hours without fail – as close to 100% of the time as I can get while ALWAYS increasing the number of lots being traded every 24 hours and using a constant Cost Basis every 24 hours.

High Trade Accuracy Daily + High Leverage Daily + Increasing Lot Size Daily + Fixed Cost Basis + Minimum Pip Capture Daily + Routine (Machine like) Execution = Geometric Growth of Capital over a very short period of time. That’s my money management formulary. Using this, I don’t have to strike gold each time I trade. I won’t need to capture 100 pips day and I won’t have to strike it rich over-night to make up for 50 bad Day Trades in a row. Smaller, consistent gains over time leads to millionaire or billionaire status in a relative short period of time. The key is consistently capturing at least a minimum number of pips that pushes the revenue growth forward according to a schedule of revenue growth over time.

So, every tool I build for this system is geared with that as its first protocol. The new tool must improve trade accuracy over time, or I cannot allow it into the system. With that in mind, I've created a new TCD Fill% Indicator that uses the previous day's TCD absolute value as the denominator in the TCD-F% calculation. So, instead of using the real-time TCD absolute value, I’ve created code that stores the previous abs value at the close of the previous session along with some other proprietary stuff. So, bottom line – my Daily TCD-F% values are different in this new test tool. This gives me two (2) Fill% types (real-time and static) to study in conjunction and hopefully a new hybrid TCD Indicator to add to the system.

Example:

EURUSD

Today’s Day Trade session (5/30/06 to 5/31/06) shows a TCD Short Fill% of 108.16% Real-Time and a TCD Short Fill% of 149.30% Static using last session’s (5/29/06 to 5/30/06) TCD Short Absolute value at the close. So, with this 108.16% real-time and 149.30% static Fill on Subordinate, I can more easily see that my “next” tradable move will be Long and back into the Dominant side as the probability for the Long move next session increases with every tic to the downside this session as long as the Dominant TCD remains Long.

Using Subordination and Domination in this way will always (by mathematical definition) place you one step ahead of the basic “trend trader”, as you will be “seeing” the “trend” shift before others do.

Also, looking to switch to the GBPUSD! I’ve been trading the EURUSD for many years now exclusively. As time goes on and my account balances increase geometrically, all I really need to do is score a few pips per day with the least amount of resistance possible. GBPUSD typically runs between 120% to as much as 180% larger than EURUSD in Magnitude as measured by my 21 period Omega using Daily data. I only need 7 pips per day to move my Revenue Model forward each day and strike my outlying revenue targets three (3) years down-range.

It is easy to get the absolute minimum pip requirement using EURUSD, and that minimum could be increased if I used GBPUSD. GBPUSD also tends to run more true in its TCDs (visually – I have not yet installed the data to confirm) at times relative to the EURUSD. Where the EURUSD seems to have larger draw-down, the GBPUSD seems to tuck in closer to the entry point reducing overall draw (visually – unconfirmed with data). So, at some point I will make the official cut-over to GBPUSD sometime soon. At the same time, the other side of that sword is that when the Day Trade entry is not optimal (meaning the system got the timing wrong), the draw-down will be bigger given the larger Magnitude of the GBPUSD.

So, there are no free lunches when shifting to a larger Magnitude pair as this places a huge premium on “Timing”. The better the Timing, the smaller the draws will be against the cost basis in each trade. If you are going to use a larger Magnitude pair, make sure you enter on good Subordinate Fill back to the Dominant side and make darn sure you know where the Dominant side resides – or that larger Magnitude pair will really draw heavily against your cost basis in the trade.

In addition, I’ve created another Predictive Indicator: Alpha-6. Basically, a variant of the original Alpha-4 and an improvement over Alpha-5. Alpha-6 has a sort of “fuel cell” built into it that give me an idea of the “magnitude of the probability”. This is new as it attempts to take measurements of the probability itself for the next TCD move. It shows the direction of the projection (Long or Short) then how much of that projected Long or Short is still remaining in the move.

So, it is really a signal that does two things: first it shows the next move as projected through Alhpa-4 and Alpha-5. Then it shows the probability for a “hold” in that direction – which is the part where it measures the staying power of the probability itself. Sort of like a dual purpose indicator and it works in ranging or channeling market conditions. The next phase of development for that new Indicator will be to modify its output once the market goes into a long-term Bull or Bear configuration. At that point, the Indicator will need to be feed more “opposition input” from the “historical trending” components within the system in order to town down the strength of its “predictive” output which will often times be in opposition to the historical trend. It will be a very delicate balance of using larger TCD time-frames to off-set some of the “predictive” nature of Alpha-6.

Advanced Discussion: (Rated “A” for Adults)

Lastly, I’m contemplating the creation of another Indicator that I will label as the: “TCD Stabilizer”. It will project the orbit of “price” as it rotates around the center line created between both TCDs. Basically, a shorter-term Price Structure Indicator which should fit in nicely to that series of indicators. For those of you that already know, no explanation is necessary. For those of you that do not already know, I don’t see price as $1.2815, for example. What I see, is something “like” a vector quantity. Something “like” an electron orbiting its nucleus where the electron is what most people would observe as “price”.

The electron may indeed be an individual “particle”, orbiting the nucleus “independently”. However, that same “individual particle” is also part of (or, forming) an electron probability shell, or put another way, a probability density. Without “price” actually existing along any specific point in the orbital path of its projected shell, I can expect that at some time (t), “price” should “appear” (for lack of a better term) at point (p), as long as the Price Structure is maintained, or is kept in a “normalize” state/configuration.

So, in this example – the Price Structure becomes the “Atom” or the atomic “structure” being maintained and at this level, predictability becomes very important. Whenever the atom begins to decay (in general terms) we call that an unstable atomic structure or going “radio active”. There are various forms of radio activity, but in this similarity, the price structure starts to behave as if it were undergoing Beta Radiation, where the nucleus of the structure becomes unstable – among other things. The orbiting electrons spun-off by a decaying nucleus create the instability. In the past, I simply called price structures that behaved this way, “Abnormal”. In the past, I considered these as being very dangerous and extremely volatile. You will find them hanging around periods where larger TCDs are crossing each other. Like during the start of a new Weekly bar, Month bar, and Yearly bar.

However, I have learned some new things about what constitutes normal and abnormal behavior in Daily Price Structures given the addition of the Annual TCD data. Daily Price Structures (the harmony between the Long TCD and Short TCD) can be stretched and extended vertically (Bull or Bear) such that either TCD becomes overly dominant, without the price structure itself becoming “abnormal”. So, my definition of “abnormal price structure” has changed given the new Annual data. I can now see that “normality” in the Daily Price Structure is indeed tied to “normality” in the Annual Price Structure and that what I used to consider as an “extreme” TCD configuration over a prolonged period of time, can simply be the result of the start of a brand new Annual TCD that was once Subordinate in its own time-frame. This makes perfectly good sense and it was sitting right under my nose all the time.

But, this begs the question: Is there ANY Daily Price Structure that would be considered “abnormal”, or “Radio Active”?

If I always enter the trade to the Dominant TCD side, then I increase the chance of always trading a “stable” nucleus – one that is not spinning off volatile radiation. That’s the “easy” way to handle TCDs. However, a more advanced way to handle TCDs would be to also trade periods of Beta Radiation, realizing that Beta Radiation comes ONLY when there is an excess of neutrons (TCD absolutes). So, the clue there would be to find those conditions when the TCD Absolute values are so massed in one extreme or the other (either Bull or Bear) that the nucleus (price structure) is imminent for creating Beta Radiation. Bingo!

Once I know that (plus or minus a few days or a few pips), I will know when the structure is about to enter into an “unstable” phase and thus, when entering the Subordinate (radio active) TCD is warranted with low risk and high probability. So, the key will be in research and trying to locate those times I history when the Dominant TCD became too “excessive”, making the nucleus of the atom (price structure) spew-out radio active Subordination in an attempt to stabilize itself.

This of course, implies/suggests a General Theory for Price Behavior:

All price behavior “desires” to conform to a state of TCD equilibrium about a perfectly horizontal plane with a centerline/longitude separating the Long TCD from the Short TCD and having zero Dominance or Subordination characteristics.

If this is the “natural” configuration of the “price structure”, then this theory would truly redefine the definition of TCD. No wonder the Annual TCD Price Structure is flatter than all the rest! The EURUSD has only been traded for so many years and the universe of possible “natural” configurations is extremely limited on such a large bar as compared to the Daily TCD Price Structure, for example. Hmmmm.

I think this general theory is very, very close to being a fact – at least in the markets I trade.

This would then (possibly) bring into existence a Special Theory of Price Behavior related to Day trade executions:

All Day trade executions from Daily Subordination into Daily Dominance result in “price” orbiting back to Dominance when the larger (Week, Month, Year, etc.) Price Structure is stable and when the Daily Subordinate TCD has penetrated that region within the Daily Price Structure which is inclusive of a high probability density for a return to Dominance.

Technically, this special theory of price behavior (based on TCDs) should (in theory) produce a Day trading system that never fails as long as three (3) conditions can be met:

1) An “exit” price target can be found that has a high probability density associated with it relative to the TCD base from which it comes.

2) An “entry” price target can be found that has a high probability density associated with it relative to the TCD base from which it comes.

3) Each trade is executed consistently on-time and each time the scenario arises.


So, this leaves me with the enticing thought that:

General Theory of Price Behavior + Special Theory of Price Behavior = zero failed Day trades.

This is in theory, of course, and this does NOT include that sometimes brutal wild card known as adverse news. Likewise, it also does not include that lovely wild card known as supportive news, either! 50% of the time, news will work against you and 50% of the time (in the aggregate) news will work in your favor – in the aggregate.

Anyway, outside the box thinking is outside the box thinking, no matter how you approach it or how you slice it. Back to work I go. I just love this business! :)
 
7thSignalTrader said:
I've said..... "trends don't exist for the trader". They do not exist from our frame of reference.

Check out the “Twin Paradox Theory” using space, time and distance as the framework for understanding “relativity”. Also, look-up the concept of mathematical “Transformations”. There are many different transformations to explore, but again – you can get an idea of the concept of events having a physical/relative relationship to each other.

The trader cannot experience a trend because he/she is not omnipresent and the trend has no physical extension beyond the past. The only extension a trend has relative to the trader is a logical extension – not a physical extension. Two entirely separate things.

God can see both, experience both and manipulate both. We can see one, experience one and manipulate neither.
OK. I've done all of that. But I traded a trend today and made some profit.

Should I smite myself?

If I see a trend. And trade that trend. And make a profit. And it doesn't exist. Should I give that profit back to my broker?

If you trade any signal from your AR machine (if it ever generates any that make a profit), and they can be proven to be against god's law and therefore, to not exist, should you and all your nicks give that money (a) back to the broker (b) back to god and his angels (c) to a charity for those who are techno-psychologically crippled (d) none of the above?

And why are you responding to a reply I made to one of your other nicks?

Oops...
 
trendie said:
tachyons ?

First, you would have to make null and void at least two (2) Newtonian facts and several primary pillars of modern physics, not to mention Einstein’s Special Relativity. Bottom line – this concept of Tachyons faster than light was introduced decades ago on a very serious level but was never placed among the giant theories in physics today. You would essentially have to alter the definition – or – find a new definition for matter itself.

Basically, in order to make this work, you would need to prove or at least provide a solid theory for how matter itself can simultaneously be considered “matter” and “something else” (what - we just don't know) capable of breaking away from the effects of expanding velocity and mass as the critical speed of light is approached – in theory, of course.

Changing the essential nature of matter to fit a theory won’t be a good solution. Discovering that “matter” is not what we once thought it was, would be bottom line brilliance. I have an open mind and am willing to explore the details that “matter” as we know it, has a fundamentally different property or characteristic that we never knew or thought was possible. But, until I see the empirical evidence that matter has a fundamentally different relationship to space/time, then I would have to still hold that nothing can travel faster than light photons.

Good observation, however.
 
npn said:
Hi 7th,…

I am at the point where my NN models got solid about consistent performance - a prediction with 10% error of daily highs and lows, for about 75% of the time. 75% on a daily basis is I think very good! Most NN models are based on at least weekly time frame, plus combing TA with fundamentals.

Well, 10% margin of error on both apex points (highs and lows) is extreme stuff especially when done on a daily basis. Wow! Now – most naysayers don’t bother to actually READ so they go off half cocked and rarely fully loaded. You on the other hand, simply read what was written and thus you are seeing some results that most naysayers can’t even fathom. I promise that they will hate you for even saying it – LOL! So, shhhhhhh – keep it to yourself. LOL! (how funny!) I just love it.

For the past six (6) years, I’ve been making the huge distinction between consistently trading a daily and routine schedule with high leverage, high cost basis, high re-investment rate and high accuracy to a minimum target that grows capital on a geometric basis. The ONLY way to accomplish geometric daily growth, is with daily accuracy. I’m glad you see and understand the massive distinction between enter a single Swing trade today, exiting in 4 weeks for 200 pips – as opposed to nailing a small 30 pips per day with high leverage, reinvestment rate, accuracy, and geometrically increasing lot sizes. The difference over time is enormously off the charts but it takes high trading accuracy to pull it all off consistently.

That means getting as close as possible to the day’s high and low. The naysayers just don’t get that concept. It goes in one ear and right out the other. They fail to understand the enormous significance of what daily interaction with the market on a highly consistent basis means. It opens up a whole new world of possibilities relative to Capital Growth and Appreciation.

It is the difference between driving a school bus around an oval track at its top speed and driving an Indy Car around that same track at its top speed. You may be driving around the “same track”, but the difference in productivity is like night and day.

10% margin of error at the tips will ALSO provide you with lots of protection against adverse news – depending on when that adverse news hits your trade. That adverse news (if it comes near an entry) will only serve to push the “current” Trajectory into more of an extreme condition which in turn will often times lead to an even bigger recoil back into the other Trajectory.

Combine this 10% margin at the tips with ONLY entering on the Dominant Trajectory from a good Subordinate Fill% (you will have to do the math and create an Indicator for what “good” means to you), and you just might be nearing 90+% Day Trade solution. I assume that 10% applies to both the High’s and the Low’s (as you have alluded to) – so, this would even include entries into the Subordinate Trajectory against Dominance! If that is true, then you are doing something that precious FEW traders anywhere are able to do on a DAILY basis. And, that is the key: doing it Daily which is what all the naysayers just don’t get.

Nicely done!


npn said:
1) When you speak of % Fill, do you always compare apples to apples? Do you only compare TCDs to their own averages, or do you mix components e.g. TCD/DAPD or Weekly TCD/Monthly TCD?

Errr..ummm (he said clearing his throat), Yes. I do. Can’t go there though!

However, I will say that the very fact that you are asking this question ALREADY says that you understand the “concept” – and it is the “concept” that matters. I call them the “Stealth II Indicators” and I don’t talk about them. Remember, once you have the baseline 30 TCD Indicators, the amount of Metadata that you can drive off of that is enormous and so too will be the potential number of relative comparisons between indicators. Creativity is required in building these particular comparative indicators and always understanding that the goal is to boost either Timing, Direction, Magnitude probability such that your entry and exist closely approximates the High and the Low for the day. The fact that you see the possible relative combinations, says a lot and I’ll leave it at that.

This moves to the deep side of the system into the stuff that I can’t give away – but I’ve hinted at it here.


npn said:
2) Speaking of Weekly and Monthly elements, do you see advantage in using calendar week and month (I presume so) vs the last 7 or 30 days and the corresponding Highs and Lows.

Yes – very important. Research on the EURUSD data clearly shows that “calendar day” does matter. Take today for example - this was 6/1/06, the start of a new calendar Month. Today, both terminated the previous Monthly bar and started a new one. You will not that basic traders only saw that a new Monthly bar was starting today. But, TCD Traders knew that the Monthly TCD Short had already begun at $1.2958 and closed on the Monthly bar “yesterday” at $1.2816 AND that the Monthly Short TCD was “already” initiated and that fact would have a strong influence on “today’s Day trade”.

So, today (6/1/06) you had the following:

This is what the basic trader can see…

a) New Daily Bar in down “trend”.

b) Old Weekly Bar in up “trend”.

c) New Monthly Bar in up “trend”.

d) Old Annual Bar in up “trend”.

Down + Up + Up + Up = Go Long or buy on dip.


This is what the TCD Trader can see…

a1) New Daily Bar with Daily TCD Short continuation with high retention.

b1) Old Weekly Bar with Daily TCD Short continuation with high retention AND Weekly TCD Short continuation with low retention and projecting Long.

c1) New Monthly Bar with Daily TCD Short continuation with high retention AND Weekly TCD Short continuation with low retention and projecting Long AND Monthly TCD Short continuation with high retention.

d1) Old Annual Bar with Daily TCD Short continuation with high retention AND Weekly TCD Short continuation with low retention and projecting Long AND Monthly TCD Short continuation with high retention AND Annual TCD Short terminated with high Long retention and projecting Long.

Down + Down + Down + Up = Go Short or sell on rally.

Clearly, using TCD concepts AND paying attention to which bars are initiating or terminating their respective time-frames, is critically important. Hopefully this example shows you why. ;)


npn said:
3) How do you select the period of averaging you components going into larger time frames? For example, do you average weekly TCD on 4 since there are 4 weeks in a month?

Daily, Weekly and Monthly data is averaged over 24 periods and I use 21 in the engine. Between 40 to 20 seem to work well. My Annual data is not finished yet, but I should be able to get about 15 to 17 periods after I reformat the Interbank data to fit inside my real-time database. So, I won’t get 21 years worth, but I should have more than enough Annual data to use in the engine when I am done.

npn said:
4) (You've spoken least about probabilities) Do you use historical reference in a form of a look up table, where you pick what happened previously given the current circumstances?

This is really too broad (wide/deep) and topic to do any justice on a forum and it is also one of my most protected concepts, so I don’t talk much about it. I simply tell people that if you truly want to Day Trade on a tight and consistent basis (routinely) then you should have a way to determine the “probability” for a move in your favor based on your entry point.

One person here (not you) seems to think that “probability” means “chances” or “odds”. That’s not a probability. Probability constructs in a system this complex is far more involved than merely generating a statistical “average” of occurrences. A probability goes several steps further and not only shows the simply statistical average of occurrences, but it should (if constructed properly) cut to the heart of the most densely populated area containing indicators and signals (because that is what your decision is based upon) that show trade that will generate the minimum number of pips you require each day.

So, the way I construct and use probabilities is much more involved than the simple “averaging of events” and the inputs used in building each real-time probability is just too dense a topic to discuss short of class-room type (lecture hall) environments. Besides – it is a very sensitive component of the system that can’t detail fully in anyway. However, the concept of why one is necessary is something that often times talk about.

Good questions and observations and great work on tightening the margin of error on those highs and lows. It seems like your knowledge of NN’s has helped you build a tool for testing and proving your theories using TCDs. Awesome! :) And, you are very correct – most people in this business are nowhere near 75% accuracy on a DAILY basis – yet this very powerful fact seems to escape many naysayers and I’ve been declaring it, showing it, demonstrating it and proving that it can be done for years now. They would rather talk about “multiple nics” that they themselves have imagined, as opposed to how to ramp up their trading to your level. Sad, but true.

Good job!
 
TheBramble said:
OK. I've done all of that. But I traded a trend today and made some profit.

This reminds me of the “guy” who would walk into work one day and begin to tell everyone how he started his day by jumping off the top of the Empire State Building and then moving on to describe what the rest of his morning was like after he hit the ground, got up and walked into Pete’s Coffee to purchased his normal and routine cup of Java and then walked over to the news stand to buy his routine daily rag, etc.

At some point, people in the office will start to look at each other in total amazement at the ease with which the “guy” just blew right past that part about jumping off the top of the Empire State Building”. LOL – funny! I mean, at least one person in the room is going to stop the guy and ask some serious questions – like: which brand of glue had he sniffed BEFORE coming to work that day! (hilarious!)

This is most funny and I do appreciate the laugh this fine morning, but you just did what that “guy” always does. You start your comments by blowing right past the very thing that makes everything else you say following your intro, totally moot.

You said:

“…But I traded a trend today…”

That’s the entire point! You can’t and you never will. Instead, what you did was trade a projection off of the primary trend today and made some profit. That’s what you did, whether you know it or not.

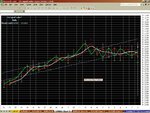
EURUSD today is a prime example of this fallacy of people “trading trends”. Take a look at what happened today to a lot of people out there. EURUSD opens and screams down approximately 90 pips. Trend traders all over the world jumped into that trade AFTER seeing it tumble from yesterday’s session down from $1.2906. They called themselves “waiting for the trend to develop”. This is hopelessly flawed and the EURUSD demonstrated exactly WHY that’s a fact when it snap-hooked at $1.2721 and skyrocketed back into its Dominant Trajectory to the Long side.

Well, what happened to all those people who jumped in AFTER waiting for the “short trend” to develop just above $1.2721? On the Day trade, they got hosed rather quickly on a 1 hour reversal that amounted to exactly 90 pips. When some of them panic-covered their Shorts, it pushed the price up even further, exacerbating the “trend traders” problem.

So, if “trends” existed for these people at the time they entered their trades, then these people would have not felt the need to panic-cover their Short positions.

Trends show a general tendency and there is no way to establish that physical tendency without establishing the physical tendency! You must "establish" BEFORE you can have an "establishment".

In order to establish something an event MUST occur. Occurrences, can only reside in history. They cannot reside in the future – nor technically, the present. If a trend is a tendency which must occur in history in order for it to exist, the Trader cannot execute on the physical manifestation of the event itself. That violates rules of thermodynamics and cause/effect (as fully detailed earlier). The ONLY thing a trader can hope for, is for his/her projection taken from the historical trend to continue as all other past events have projected.

You cannot trade that which does not exist. For the “trader”, trends do not exist. For the historian and researcher, historical trends do exist. This should be crystal clear – cut and dry by now. All a trader has is a projection, a theory, an estimate, a calculated extension of an historical fact called the historical trend. But, one can NEVER trade it – no more than one can climb back into his/her Mother’s womb and be physically reborn.

One can be spiritually reborn, but never physically reborn, because the physical instantiation of your birth required that Potential Energy be converted into Kinetic Energy where the “matter” that makes up your physical body came into existence through that matter that ALREADY existed in your Mother and Father (conservation of energy – engery cannot be destroyed or created ONLY converted.)

The potential energy in the volume within the market moved prices creating the kinetic energy of the historical trend (price movement). Again, conservation of energy is made clear. In order to “interact” (trade the trend) with the energy making up the historical trend, you would have to be able to bring to an abrupt halt the very promise of thermodynamics and create energy by becoming a part of the potential energy that generated the historical price movement and that is totally, completely, 100% nuts!

Give it up and stick to trading “projections” off of historical trends. I don’t know how to make it any more crystal clear than this.

TheBramble said:
Should I smite myself?

No. One might want to correct him/her self when the handwriting is clearly on the wall and they have been given ample room and measure to correct themselves – which you have been given in rather large doses.


TheBramble said:
If I see a trend. And trade that trend. And make a profit. And it doesn't exist. Should I give that profit back to my broker?


Anyone can see the historical trend and trade a projection from such historical events. No one can see the physical evidence of a thing that has not yet appeared. Trends are historical in nature. That is what a trend is composed of – historical events. Therefore, it is impossible for anyone to physically execute on history. You are trading projections taken from history – but you are not trading history itself. That’s impossible unless you can travel through space and/or time as we know it. If you can do that – THEN you can trade a trend but ONLY if you have the ability to exist BOTH in the present AND in the past.

(PLEASE FOLLOW THIS VERY CAREFULLY)

So, even IF you could travel through space and/or time to a “past event” knowing what the future direction of price would be – you STILL would not be able to execute on trading the “trend” that YOU observe from that point in the past. To YOU, that point would not be included in the path of the “historical trend” at that time.

Only to the observer in YOUR FUTURE would the “historical trend” be visible. To YOU, from your position relative to the movement of price, the future of price behavior would be an unknown variable. The only way for you to know price behavior and trade the trend, would be for you to have the ability to exist at BOTH points “A” (the past) and “B” (the present) at the exact same time.

In that case, your trade from position “A” would be based on a “projection” of the position “A” historical trend, while your trade from position “B”, would be based on the “historical trend” observed from position “A”. ONLY in this way, is “trading the trend” possible, but even here you would not be trading the trend of position “B”, the present – because in position “B”, the position “C” (the future) historical trend can ONLY be observed from position “D” which would in logical turn be position “C’s” history.

You would have to be able to physically occupy at least two (2) locations in order to trade just one (1) trend. Otherwise, you are forced to trade nothing more than a projection of what you CAN observe. You cannot observe position “C’s” historical trend WITHOUT knowing the price behavior between position “B” and “C”. Since “C” has not occurred yet and you cannot travel into the future, you cannot trade its trend. Thus, all you can ever do is trade the position “A” historical trend and watch as the price behavior between positions “A” and “B” unfolds in real-time.

Not too difficult to understand when you really get serious (real) and stop to think about it.

TheBramble said:
If you trade any signal from your AR machine (if it ever generates any that make a profit), and they can be proven to be against god's law and therefore, to not exist, should you and all your nicks give that money (a) back to the broker (b) back to god and his angels (c) to a charity for those who are techno-psychologically crippled (d) none of the above?

I think your inability to realize what’s going on here or what’s being said is astoundingly apparent. I think you are sinking and not swimming in this discussion. I think you are struggling in a futile effort to prove something that is impossible to prove. And, I think your weak attempts at sarcasm fall flat in the presence of your inability to fully grasp the depths of your problem.

1) This system was not created to prove anything. It was created to make money – period. And, it has been doing that with increasing levels of accuracy for the last 3 to 6 years as it has grown and developed through various stages of efficacy.

2) Its called “AI”, not “AR”.

3) I don’t need another dollar from the market. What I don now, is expressly for the benefit of others (less fortunate in life) who cannot otherwise help themselves around the world.

4) Technology was given to Man for a purpose. If he’s been too foolish with the knowledge allowed to him, it can either be taken away, or (and this is much more likely) mankind will ultimately destroy himself with it. Technology is not bad, people are. Being technically ignorant is not a crime. Closing both eyes, plugging both ears and begging not to be educated should be a criminal offense punishable by death – no just kidding. It should be a criminal offense, however and people should have to pay a fee for holding on to the “please don’t confuse me with the facts” mentality.

TheBramble said:
And why are you responding to a reply I made to one of your other nicks?

Why would you be creating events that have not occurred? And, why are you so “challenged” by common sense? This is a dialectic medium called an online forum. People “dialog” in a “dialectic medium”. When you reply to somebody else, that is an open invitation for anyone to engage any aspect, portion, part or piece of your reply.

How many times have you replied to someone that was dialoging with another member on the forum? People hold two-way communications when they are using radio waves to dialog with, most typically found in the world of aviation where the pilot comms with the tower, ground, approach or departure control. THAT is where you would expect strict rules of maintaining two-way comms. Not on a forum such as this.

Think AND read, BEFORE you type – it would be far less embarrassing for you.
 
Last edited:
7th,

I'm curious, in very simple terms, if possible, can you say whether you traded any of today or yesterdays Euro moves and why? I'm not interested in you edge or methods, just after a full days trading, trying to comprehend one of your essays is a tad much, and after reading some of your comments, it would be interesting to hear how you saw it.

Thanks
 
Top