BeginnerJoe
Senior member
- Messages
- 3,329
- Likes
- 351
pure lulz 😆😆😆
Nut'ing lulzy about it. Here, took a couple of goes, and got shaken out by a fib level. I am still wanting to short it. But under observation for now.

pure lulz 😆😆😆
got shaken out by a fib level
You mentioned a kind of 'vacuum effect' in your first post. In my opinion this is very, very common and very important. It could to a large extent be the basis of an entire method, albeit one that requires balls as big as a bag full slapoopies to execute. It would principally be a reversal strategy which most people should avoid, but it can be a very good way of getting in very early with very tight stops.
If you really want to see it in action or explore it further, look at futures under a microscope - such as a five minute or fast tick chart - it becomes very obvious what is going on. Combine this with a bit of thought about actual market mechanics and away you go.
Like I say, it's not one for beginners or the faint of heart, because essentially it looks like stepping out in front of an express, and quite often you will be. But the winners will often be vast.
As an aside, it can also be quite a useful concept when determining exit points.
thanks BJ you cheered me up no end.
quite lulzy price action around the hourly resistance zone. any break out long guys would have been killed, breakout short guys also killed.
CD, just my opinion here, but once you have 2 false breaks and retreats then it suggests the zone wasn't a true S/R zone and I leave it alone (or stop trading it if I had 2 losses). In days like that you don't want to keep trying all day and pile up the losses.
My opinion and experience only, nothing I can quantify really.
Peter
Again, just my opinion, but this was going for the daily lows of July 12th/13th, maybe even an attempt to go for the low of July 16th. So the hourly zone had to take a back seat.
Also, your chart doesn't show a clear direction prior to hitting the zone. How did you determine the zone?
Peter
Again, just my opinion, but this was going for the daily lows of July 12th/13th, maybe even an attempt to go for the low of July 16th. So the hourly zone had to take a back seat.
EUR looks to have failed at the 1m double top. I am short again. The same fibs level that shook me out is currently at play. I am betting it to fail.
The euro at the moment probably wasn't a great example
I like waiting until price reaches the blue zone(s) and then look for a failure bounce especially a pullback to the trend. The chart you show is clearly in a downtrend so my preferred play would be to wait for a clear upward bounce and a move back to the blue zone, then I'd look to short.
IMO S/R is one of the simplest ways to trade. Nothing guaranteed of course but very little stress if you keep proper stops and stay with the trend.
Peter

The hare claimed he analysed fibs and found nothing.
like yourself I prefer to play where there is a clear and unambiguous zone in sight.
[snip]
My personal preference for S/R is to see if the level holds for an extended period and look at the shape of it on charts. Very often I've noticed that price "arcs" around strong S/R (no matter the T/F). Then it's just a matter of waiting for the right time to strike.
[snip]

👍
That's why it's often useful to look at a wider time frame chart and get a better perspective.


Hi
I thought i would start a new thread on this popular topic and hopefully spark some useful debate.
Forget the instrument and the time frame lets discuss support and resistance.
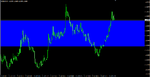
You can see below a H1 chart of spot EURUSD, time frame doesn't matter, instrument doesn't matter it's just an example. On the chart I have marked a blue area where I believe in the future IF price reaches the blue area price may find support. The chart has candlesticks, this doesnt matter could equally be a line graph.
My understanding from many hours of screentime, is that price is likely to find support at the blue zone, price will then either then break through the support before continuing or rebound before moving away from the zone. Of course price could run all over the blue zone as well and do a combination of both.
I try to think of support and resistance in terms of market psychology. So we know that market participants are likely watching this blue zone. As we approach the blue zone from above there will be people who are already short, those people may look to take profits at the support (those that do think price will come back). Then there are those that are long already and are taking some heat, they might be thinking I am going to hold this and see if we get a bounce, if we don't them I am out. Then we have the third group, perhaps the largest (???) who are flat and they are thinking I am going to wait and see what happens at the blue zone before making a decision on whether to enter.
So it is quite a complex set of human emotions, fear and greed etc that each market participant is experiencing whether they are long, short or flat.
I have been thinking recently about a phenomenon I have noted that price tends to always reach a major previous support and resistance area when close by. It is a little difficult to observe correctly as clearly if something is moving towards something else then the momentum is likely to take price further. Biases are in play.
This is just something I have noted in addition to other strategies I play (which are not the topic of this thread).
My thoughts on the matter were say price is fast approaching a major previous support area. Lets take the situation of the participants again.
(i) the person who is flat - they may well think to themselves, I am just going to wait here and see what happens. i.e. they continue to do nothing.
(ii) the person who is short - they are probably thinking I will take partial or full profits at the support zone.
(iii) the person who is long - they are feeling the heat but maybe they think, I am going to hold this and see if I get a bounce. or they sell and remove liquidity from the bid thus fueling the move down further.
The above 3 participants could have the effect of a status quo in the market a kind of vacuum, this would have the effect of the momentum in the market moving towards the support just being allowed to flow on to the zone. With the majority of the traders who are flat not seeking to enter until the zone is reached this potential activity is not present to turn price around early increasing the likelihood that price will continue on its current path.
Check it out for yourself, pull up any chart, any instrument, any timeframe say H1+ to ensure the most participants are thinking about a future level. Then watch price as it moves towards that level, what I have noticed is that when it gets close it nearly always gets there. - if you get what I am saying
I am wondering if this can be formalised into a strategy, whether it could be made to work.
On the other hand I am probably just talking a load of cobblers.
All thoughts / comments welcome.
Good trading.
PS - This is not a strategy I use I am just musing some ideas.