Dow, Nas and S&P all slumpin' this week, but, a nice bit of support shown yesterday, could move them north again for a while next week, as user says, all eyes on 10750? ( should'nt really bother mentioning Nas, it's moved sideways all this year, what's goin' on there?). Still, probably not enough support shown for a good end to the correction. Expirey date on friday should throw another spanner in also. Good trading all!
You are using an out of date browser. It may not display this or other websites correctly.
You should upgrade or use an alternative browser.
You should upgrade or use an alternative browser.
User
Experienced member
- Messages
- 1,170
- Likes
- 23
Extremely interesting chart......
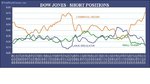
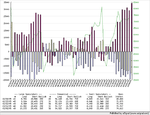
The chart attached is showing something of major significance and this type of data should not be ignored by T2W members.
The commercial hedger is extremely bearish on the Dow Jones. The last time the commercial hedger had such a bearish stance was when the market was at its highs in 2000.
The Large speculator and the small trader (dumb money) have their lowest short holding since 2000.
This sort of data supports the view of a market top. However should we see a breach of 11,000 then we could go slightly higher. 12,000 and 13,000 are not going to occur.
In my opinion it is pretty much certain that a market top has been made. Should we see moves up towards 10880-900 or 11,000+ then I will be entering large shorts using long term contracts. The economic outlook for the next five years is looking quite bleak on most fronts and that includes stocks.
Note the commercial hedger usually doesn't pinpoint its timing when entering the market but traders should not bet against their powerfull flow of money. We are near enough at the end of this run that we have seen since the start of the War in Iraq. Traders now should be aware of the fact that the market is near enough ready to turn into a long term bear market.
Attachments
cheers user, what are you waiting for then? get short and join the bears.....
This week should be fun, I''m looking at 10740 as support running from the trendline of the october rally. Also there is a fib level from the jan lows to march highs somewhere in the region(10730). My target on my short position since 10950 will be 10,600 where I'm hoping to 1/2 position. I am a little worried that all this talk of tops etc. is a little premature. I don't think people are prepared to give up on the upward trend and 11,000 just yet! What would help would be if crude could mount another go at the top and if the 10 year hits 4.70/4.80 then that could spook people. what is your target for the week then? My best guess is we will test 10,700 but i wouldnt be surprised to see a bounce one day early this week, like monday!
This week should be fun, I''m looking at 10740 as support running from the trendline of the october rally. Also there is a fib level from the jan lows to march highs somewhere in the region(10730). My target on my short position since 10950 will be 10,600 where I'm hoping to 1/2 position. I am a little worried that all this talk of tops etc. is a little premature. I don't think people are prepared to give up on the upward trend and 11,000 just yet! What would help would be if crude could mount another go at the top and if the 10 year hits 4.70/4.80 then that could spook people. what is your target for the week then? My best guess is we will test 10,700 but i wouldnt be surprised to see a bounce one day early this week, like monday!
User
Experienced member
- Messages
- 1,170
- Likes
- 23
I'm not too sure about a target this week. Will be watching 10740-50 very closely as this could be the pendalum which could swing us towards 10880 or 10600. Lemput the chart shows that the real bulls are already giving up and are turning into bears.
peterpr
Established member
- Messages
- 609
- Likes
- 7
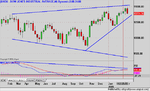
Daily chart - Megaphone + rising wedge + MACD 12 month Neg div. Crikey ! That's a pretty potent combination. Wedges often end with blow-off spikes though, so it's just possible that we'll see another surge up first. YM currently sitting at 10822 - Fair value for June contract currently +30 points or so - so thats a premium of @18 points over Friday's main index close
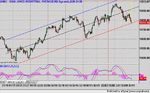
90 minute - Sitting right on lower boundary of an 85% reg. channel. Room for a bit more downside to increase that to @90% (and touch the lower wedge boundary on the daily, then bounce ?) - so beware, MACD neg div from the December high.
On balance I'd say a down week ahead, but still in process of forming a major multi-month (year?) top so shorts beware - The market never collapses before you've all been killed off. IOW's - fishing for a top can be a dangerous undertaking.
Edited - wrong chart replaced with corret 90 minute one
Attachments
Last edited:
peterpr
Established member
- Messages
- 609
- Likes
- 7
Oh - forgot - That does look like a rather well-formed H&S top on the 90 minute chart too - which also argues for a rapid descent to at least 10650 or so. Problem is the MACD (not shown on this chart but on chart in previous post) is in OS territory and looks about to turn up again
Attachments
counter_violent
Legendary member
- Messages
- 12,672
- Likes
- 3,788
Peterpr
Great summary of current situation
This major divergence is what i alluded to a few weeks past
Very interesting week ahead, but shorters beware, good clean break through 10,740/30 required for the bull to lie down. Even if this event occurs then 600 should provide some support with possible bounce back to 900 all I M H O 😉
GW's Elliott interpretation is always worth keeping an eye on:
http://forum.tacticaltrader.com/viewtopic.php?p=35803#35803
You might need to register to view.
http://forum.tacticaltrader.com/viewtopic.php?p=35803#35803
You might need to register to view.
roguetrader
Senior member
- Messages
- 2,062
- Likes
- 49
Interesting week ahead, options expiry week also, front month open interest on OEX suggests that this week should not close with any significant advance. However it is worth pointing out that this theory is very much "a work in progress" and I certainly would not recommend anyone to tarde by it without close study, Market predictions beyond the intraday are merely a hobby for me.
peterpr
Established member
- Messages
- 609
- Likes
- 7
I'm moderating my view to mildly bullish - ish (ouch - untie knot in tongue) for the week !
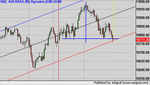
Been studying the YM COT numbers for w/e 8th March. As of then we have the largest open interest position on this contract for 12 months - 84,000 contracts. 73% of large commercials are long; 64% large Specs short; 63% small specs short. Commercial net longs leapt up 7 weeks ago (at start of the New Year leg up and has risen nearly every week since to present 12 month high. Its not clear cut stuff but historically the commercials have had the edge.
I'm one of those who is expecting a serious serious decline soon. But the above does suggest that it's not immanent
It's tempting to view the size of open interest as a prelude to a large move but there's no real correlation on this contract - over the past 12 months anyway.
Attachments
peterpr
Established member
- Messages
- 609
- Likes
- 7
lemput said:peterpr, how does your data match up with users chart on commercial hedgers and large speculators? It seems to be the exact opposite!?
Lemput / User
I hadn't studied User's charts or post - sorry. But, having done so the chart appears to be saying exactly the same as mine but with a zero line missing.
Above zero on my chart equates to longs; blow to shorts. The commecials dominate the long side and the large & small spec the short side. The bar ends of my commercials corresponds to U's orange line etc.
The problem with U's chart is that it doesn't appear to have a zero line. It SHOULD have one and it would run horizontally at about .45 on the left hand scale. U's post seems to assume that all three lines are showing shorts - but they're not, they're oscillating above and below a zero which is not shown.
Users Chart
Don't understand your point about the absence of a zero line. There is a zero base on his chart with commercial hedgers at 0.70 and large specs and small traders between 0.1 and 0.2.
...........................................................................................................................................................................peterpr said:Lemput / User
I hadn't studied User's charts or post - sorry. But, having done so the chart appears to be saying exactly the same as mine but with a zero line missing.
Above zero on my chart equates to longs; blow to shorts. The commecials dominate the long side and the large & small spec the short side. The bar ends of my commercials corresponds to U's orange line etc.
The problem with U's chart is that it doesn't appear to have a zero line. It SHOULD have one and it would run horizontally at about .45 on the left hand scale. U's post seems to assume that all three lines are showing shorts - but they're not, they're oscillating above and below a zero which is not shown.
Don't understand your point about the absence of a zero line. There is a zero base on his chart with commercial hedgers at 0.70 and large specs and small traders between 0.1 and 0.2.
roguetrader
Senior member
- Messages
- 2,062
- Likes
- 49
I had interpreted users chart as a ratio chart like shaefers put/call ratio. a number below 1 indicates net short and a number above 1 equalsnet long
Users chart shows the orange decreasing there shortpositions by that interpretation
Users chart shows the orange decreasing there shortpositions by that interpretation
Users Chart
That's not Users interpretation - perhaps he could clarify this since he made a very strong point about commercial hedgers hitting a high on their short positions and dumb money hitting a low (and therefore going long) on their positions.
............................................................................................................................................................................roguetrader said:I had interpreted users chart as a ratio chart like shaefers put/call ratio. a number below 1 indicates net short and a number above 1 equalsnet long
Users chart shows the orange decreasing there shortpositions by that interpretation
That's not Users interpretation - perhaps he could clarify this since he made a very strong point about commercial hedgers hitting a high on their short positions and dumb money hitting a low (and therefore going long) on their positions.
Similar threads
- Replies
- 1
- Views
- 4K
- Replies
- 1
- Views
- 5K